These header images are the default header images for the site.

Final Estimates of ARC-CO and PLC Payments for Crop Year 2024

By: Oranuch Wongpiyabovorn and Alejandro Plastina

February 6, 2026 | RaFF Policy Brief 2026-2(1)

The goal of this policy brief is to provide estimates of Agricultural Risk Coverage (ARC) and Price Loss Risk (PLC) program payments for all covered commodities for crop year 2024 using final marketing year average prices and county yields.

Download Full Policy Brief

Overview

For crop year 2024, the United States’ Farm Service Agency (FSA) started issuing ARC and PLC payments to eligible enrolled base acres in October 2025. As of February 2, 2026, marketing year average (MYA) prices and county yields for crop year 2024 have been finalized for all covered commodities, and program payments are expected to be distributed to farmers. RaFF released the estimates of ARC at the county level (ARC-CO) and PLC payments for wheat, barley, and oats in July 2025, with total estimates of $151 million for wheat, $2.3 million for barley, and $1.5 million for oats (read the full article here). This brief provides an update to those early estimates and presents the final estimates for all other covered commodities.

Concluding Comments

Given the final MYA and county yields for crop year 2024, we estimate total ARC and PLC payments would amount to $2.34 billion—$2.04 billion from ARC-CO and $0.30 billion from PLC. The majority of the payments would be distributed to corn and soybeans base acres, especially in the areas affected by severe weather.

In comparison, these estimates are slightly lower than FAPRI (2025)’s projections in September 2025 and Paulson et al. (2025)’s estimates in November 2025. Specifically, FAPRI (2025) projected the national ARC and PLC payments in 2025 (for crop year 2024) to amount to $2.50 billion—$1.92 billion from ARC and $0.59 from PLC, while Paulson et al. (2025)’s estimates reach $2.59 billion—$2.29 billion from ARC-CO and $0.29 billion from PLC.

Follow RaFF on Social Media
Scan to have the latest RaFF updates sent to your inbox:

Image

Contact Information

Oranuch Wongpiyabovorn, Senior Research Associate, RaFF: owongpiyabovorn@missouri.edu

Alejandro Plastina, Director: aplastina@missouri.edu

Acknowledgements

The development of this Policy Brief was supported by the US Department of Agriculture, Office of the Chief Economist, Award ID 58-0111-23-017. The findings and conclusions in this report are those of the authors and should not be construed to represent any official USDA or US Government determination or policy.

Tables & Figures

All tables are in an accompanying excel file.

Download Tables & Figures
References

Tables

Figure 1. 2024 ARC-CO and PLC Enrolled Base Acres by Commodity.
Enrolled Base Acres by Commodity
Source: USDA (2026a)

The chart compares 2024 enrolled base acres (in millions) for commodities under the PLC and ARC-CO programs, showing clear differences in program participation by crop. Corn has the largest enrollment overall, with 71.0 million acres in ARC-CO compared to 21.6 million in PLC.

Commodity

PLC

ARC-CO

Corn

21.6

71.0

Safflower

48.0

29.7

Chickpeas (Large)

17.3

51.8

Wheat

31.7

30.3

Soybeans

5.2

47.4

Mustard Seed

10.3

13.8

Chickpeas (Small)

5.0

15.5

Grain Sorghum

3.9

4.6

Seed Cotton

5.7

2.2

Sesame Seed

2.6

3.0

Barley

3.3

2.0

Rice (Long Grain)

3.8

0.0

Crambe

0.9

1.8

Rapeseed

0.9

1.5

Peanuts

2.3

0.1

Sunflower Seed

0.7

0.9

Canola

0.9

0.6

Rice (Temperate Japonica)

0.4

0.1

Dry Peas

0.2

0.3

Lentils

0.1

0.2

Flaxseed

0.1

0.1

Rice (Short/Med) Grain

0.2

0.0


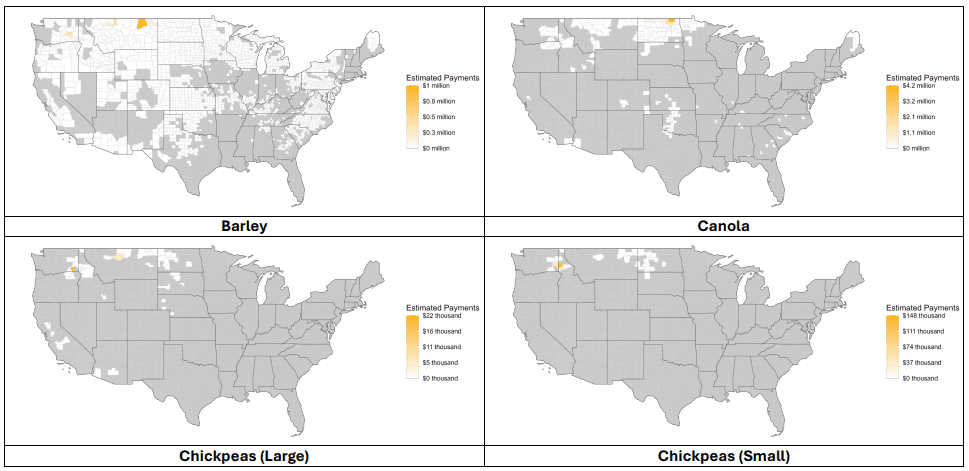
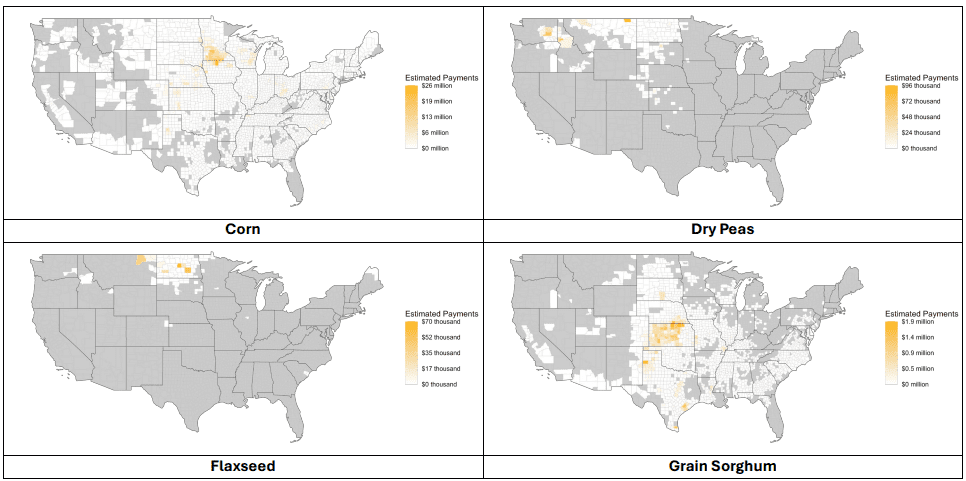
Figure 2. Total Combined ARC-CO and PLC Payments for Crop Year 2024 by Commodity
Four U.S. county-level choropleth maps showing estimated crop payments, with darker orange indicating higher payments and gray indicating little or no payment. The top-left map shows estimated payments up to $1 million, with higher concentrations in parts of the Midwest and Pacific Northwest. The top-right map shows payments up to $4.2 million, with the highest amounts concentrated in the Northern Plains and Upper Midwest. The bottom-left map, labeled “Barley,” shows payments up to $22 thousand, primarily in scattered counties in the Northern Plains and Pacific Northwest. The bottom-right map, labeled “Canola,” shows payments up to $148 thousand, concentrated mainly in northern states such as North Dakota and Montana.
Four U.S. county-level choropleth maps showing estimated crop payments, with darker orange representing higher payments and gray representing little or no payment. The top-left map, labeled “Corn,” shows estimated payments up to $26 million, heavily concentrated across the Midwest Corn Belt, particularly Iowa, Illinois, Nebraska, and surrounding states. The top-right map, labeled “Dry Peas,” shows payments up to $96 thousand, primarily in northern states such as North Dakota and Montana. The bottom-left map, labeled “Flaxseed,” shows payments up to $70 thousand, concentrated in the Northern Plains, especially North Dakota and Minnesota. The bottom-right map, labeled “Grain Sorghum,” shows payments up to $1.9 million, with higher concentrations in Kansas, Texas, and parts of the central Plains.
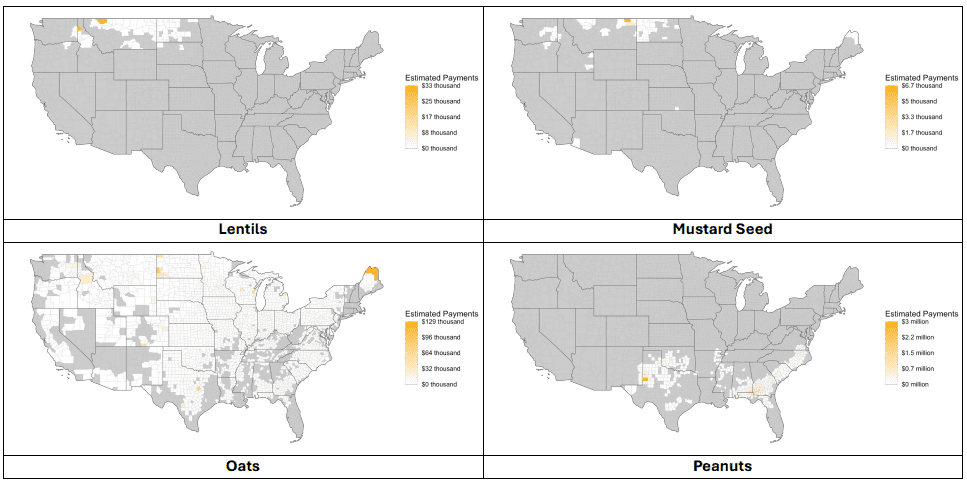
Four U.S. county-level choropleth maps showing estimated crop payments, with darker orange indicating higher payments and gray indicating little or no payment. The top-left map, labeled “Lentils,” shows payments up to $33 thousand, concentrated mainly in northern states such as North Dakota and Montana. The top-right map, labeled “Mustard Seed,” shows payments up to $6.7 thousand, also primarily in the Northern Plains. The bottom-left map, labeled “Oats,” shows payments up to $129 thousand, with concentrations in the Upper Midwest and parts of the Northeast, including northern Maine. The bottom-right map, labeled “Peanuts,” shows payments up to $3 million, concentrated in the Southeast, particularly Georgia, Alabama, and surrounding states.
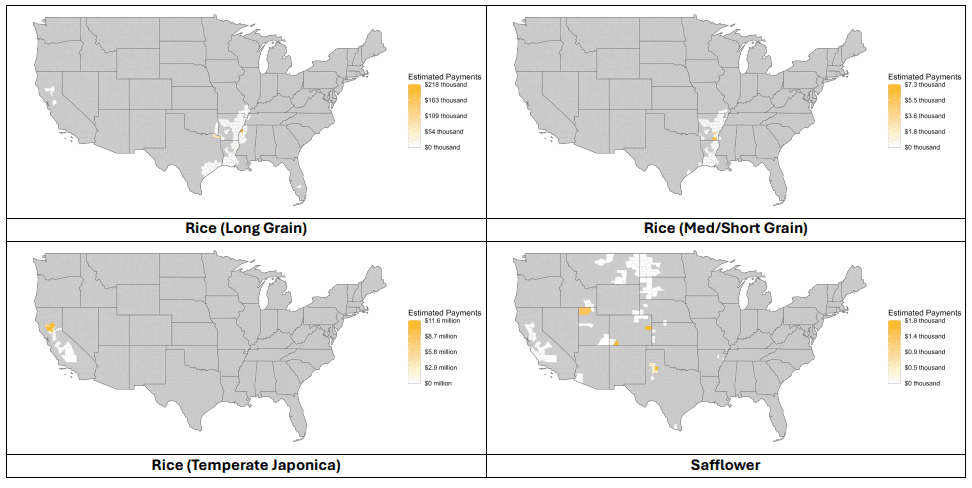
Four U.S. county-level choropleth maps showing estimated crop payments, with darker orange indicating higher payments and gray indicating little or no payment. The top-left map, labeled “Rice (Long Grain),” shows payments up to $218 thousand, concentrated in the Mississippi Delta region, including Arkansas, Mississippi, Louisiana, and eastern Texas. The top-right map, labeled “Rice (Med/Short Grain),” shows payments up to $7.3 thousand, with small concentrations in parts of the Delta and California. The bottom-left map, labeled “Rice (Temperate Japonica),” shows payments up to $11.6 million, heavily concentrated in California’s Sacramento Valley. The bottom-right map, labeled “Safflower,” shows payments up to $1.8 thousand, scattered across parts of the western and central United States, particularly in Colorado and California.
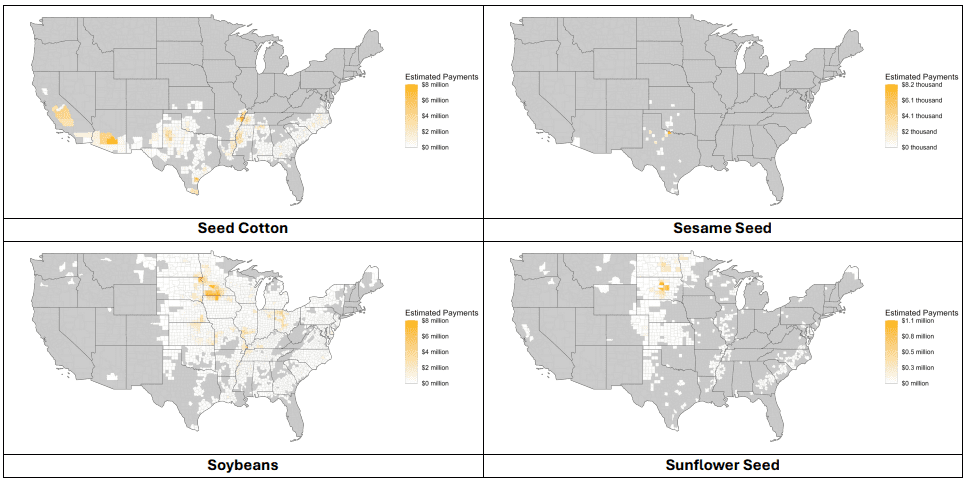
Four-panel U.S. map showing estimated payments by county for Seed Cotton, Sesame Seed, Soybeans, and Sunflower Seed. Counties are shaded from light to dark orange to indicate higher payments. Seed cotton payments are concentrated in the southern U.S., especially Texas and the Southeast. Sesame seed payments are sparse and limited to a few counties, mainly in Texas and nearby states. Soybean payments are widespread across the Midwest and parts of the South, with the highest concentrations in the central Corn Belt. Sunflower seed payments are concentrated in the northern Plains, particularly North and South Dakota.
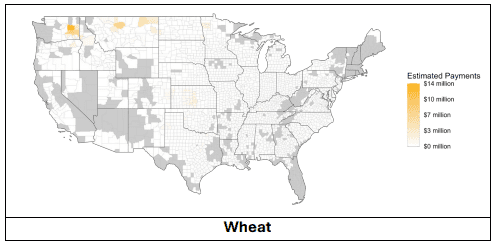
U.S. county-level map titled “Wheat” showing estimated payments shaded from light to dark orange, with darker shades indicating higher payments (legend ranges from $0 to $14 million). Payments are concentrated in the northern Plains and Pacific Northwest, particularly parts of Montana, North Dakota, and Washington, with lighter amounts scattered across the central Great Plains and minimal payments in much of the Southeast and Northeast.