
Insights on Ag Credit
For many U.S. farms, debt financing supports day-to-day operations and opportunities for business growth. Therefore, the ag credit landscape matters a lot to farm financial strength. The following insights unpack multiple topics related to ag credit — from trends in farm loan borrowing to the state of ag loans on lender balance sheets. They inform effective policy by pointing out ag credit risks and conditions.
Harbinger of Farm Financial Stress? A Look into Whether Farm Debt Repayment Capacity Sentiment or December Corn Futures Predict Farm Loan Delinquency Rate Changes
June 4, 2025
By: Joe Parcell, Jennifer Ifft, Alice Roach, Bryston Warren, Nathan Francis
Heeding the signs of farm-sector financial stress greatly improves the chances of taking well-timed actions to support the farms at greatest risk. As part of an effort to find early warning signals, we evaluated whether commercial banker sentiment about credit conditions could suggest forthcoming changes in farm financial stress.
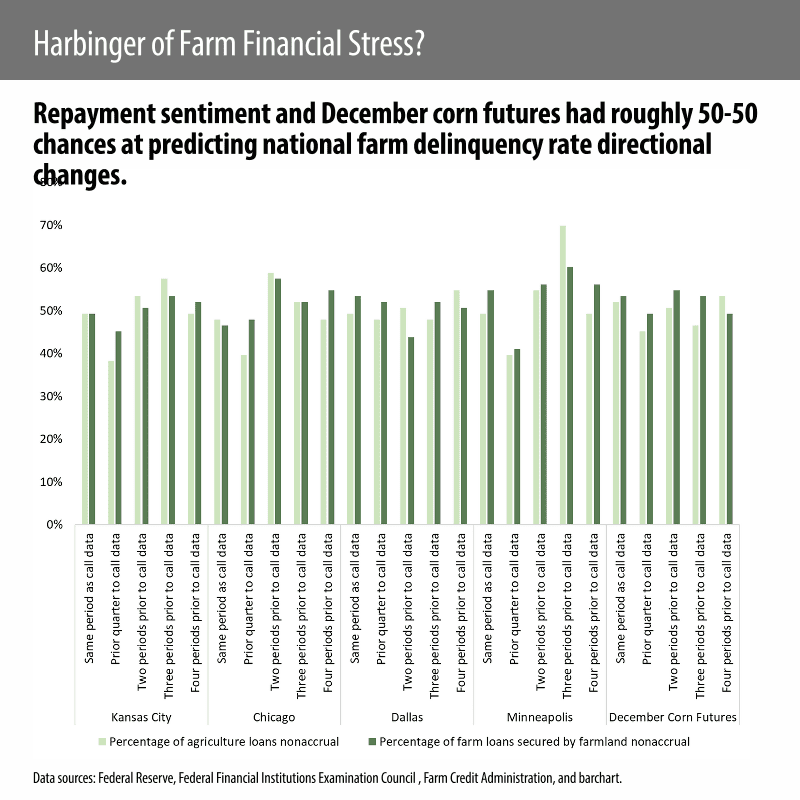
We compared how well banker sentiment of repayment rates matched up to later changes in farm loan delinquencies. To round out the study, we also assessed how well a change in corn futures prices foretells a change in farm loan delinquencies.
By combining delinquency data from the Federal Financial Institutions Examination Council and Farm Credit Administration, we computed weighted average state-level delinquency rates reflective of commercial bank and Farm Credit association lending activity. States included in the analysis were Missouri, Iowa, Nebraska, Minnesota, Kansas, Michigan, Illinois, Arkansas, Texas, Indiana and Ohio. We also looked at national weighted average delinquency rates. Our analysis used quarterly data between 2005 and 2023.
We gathered banker sentiment of loan repayment rates from Federal Reserve Banks of Kansas City, Chicago, Dallas and Minneapolis agricultural credit conditions surveys. For each state and at the national level, changes in each Federal Reserve district’s average repayment sentiment, as well as corn futures, were compared to delinquency rate changes for agricultural loans and loans secured by farmland. [ Two caveats: 1) we use only public facing data published by the Federal Reserve banks and 2) Federal Reserve banks publish other indicators of credit conditions, but we analyzed only the single measure of loan repayment rate sentiment].
These three points summarize our general findings:
1️⃣ Neither a change in banker’s repayment sentiment across Federal Reserve districts nor change in corn futures price foretold a change in farm stress better than a flip of coin; they each had roughly a 50-50 chance at predicting a delinquency rate change. Corn futures had a slight edge. Both variables were better at predicting national-level delinquencies than state-level delinquencies.
2️⃣ Banker repayment sentiment changes better foretold a change in financial stress a year in advance than three months or six months in advance.
3️⃣ A change in banker sentiment was slightly better at serving as a leading indicator for changes in delinquencies for loans secured by farmland relative to delinquencies for ag production loans.
Risk in Lending
August 28, 2025
By: Joe Parcell, Jennifer Ifft, Alice Roach
Like any entity that extends debt to borrowers, agricultural lenders face repayment risk. In essence, a borrower who cannot repay a loan’s principal plus an interest charge will pass on financial uncertainty to the lender. The lender then must sort out options to recoup at least part of the loss.
Using ag lending as an example, repayment risk — similar to other forms of risk — has three components:
1️⃣ Probability that a risky event occurs (e.g., cash flow problems make a borrower unable to repay a loan)
2️⃣ Exposure at occurrence (e.g., how much is left on the loan plus interest when a borrower is first delinquent on making payments for a financed asset such as a tractor)
3️⃣ The amount of unrecoverable loss when a risky event occurs (e.g., difference between the outstanding loan balance and the asset value the lender recovered)
When a lender is unable to fully recover a remaining loan amount, it records a charge-off. Note, a charge-off only occurs if the loan is considered delinquent and the borrower is unable to repay it. Financial institutions like banks hold reserves, so when they experience a net negative charge-off, the loss goes against the institution’s loss reserves.
To evaluate a lender’s financial health, net charge-offs represents an important metric to track because it reflects delinquent loans and the value of the assets lended on versus remaining loan balances. Banks expect a small percentage of borrowers to face repayment challenges. However, when a particular bank has a substantial increase in net charge-offs, it signals poor loan-making decisions a local economic issue causing repayment challenges, or a macroeconomic problem that will affect most other banks.
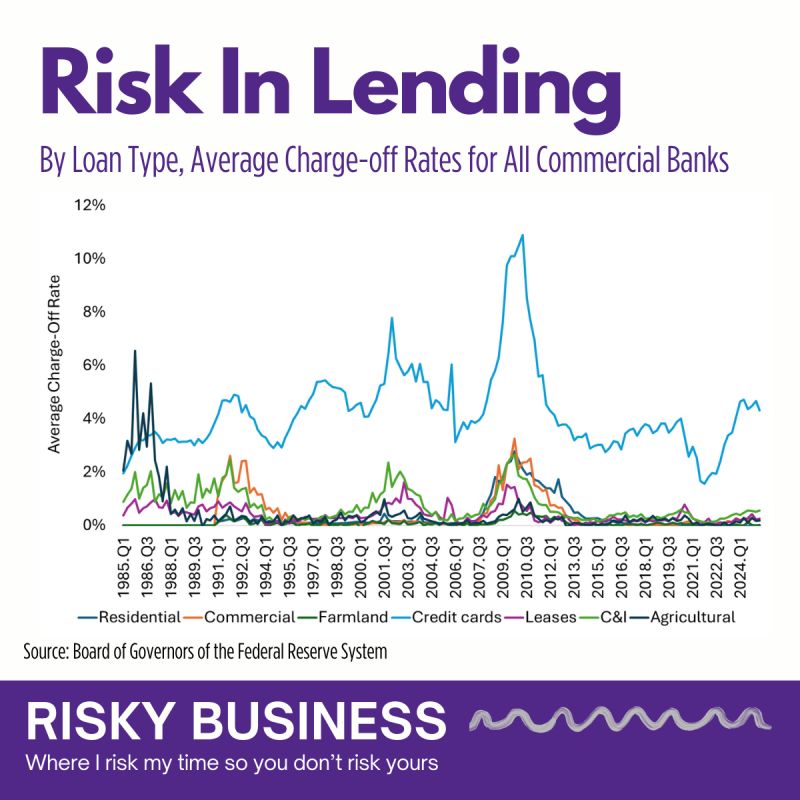
The graph shows U.S. charge-offs recorded by commercial banks for different loan types since 1985. Relative to most other loan types, agricultural production loans and loans secured by farmland had lower net charge-off rates, which compare net charge-offs relative to total loan volume.
The takeaway — when farm businesses default on loans, the asset value generally has been sufficient to cover the loan balance.
Connecting Farm Income, Loan Risk and Bankruptcies
April 20, 2026
By: Joe Parcell, Jennifer Ifft, Alice Roach
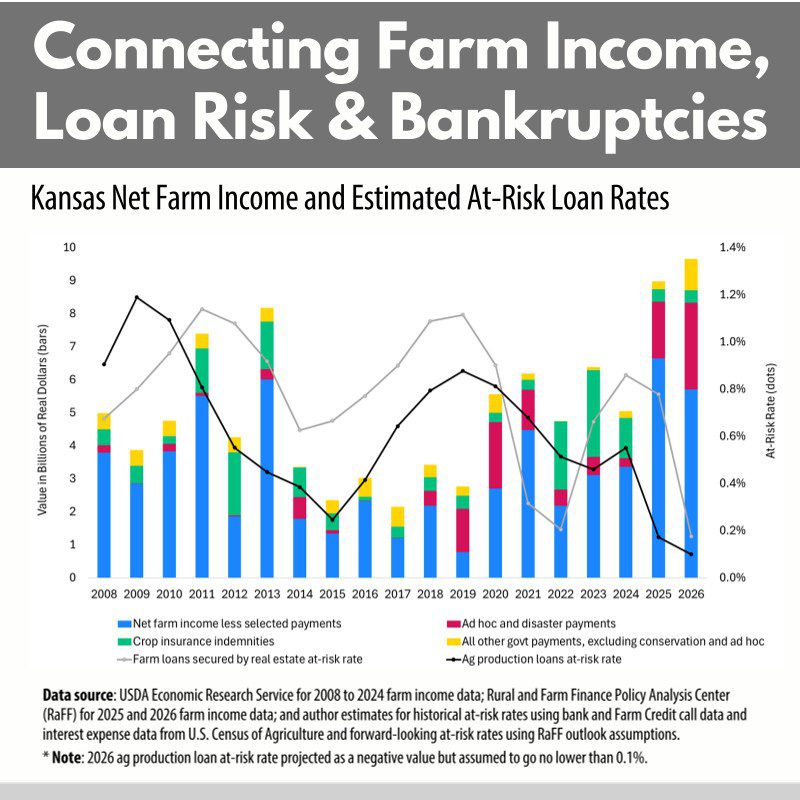
In an outlook released last week, the Rural and Farm Finance Policy Analysis Center (RaFF) projects an increase this year in Kansas net farm income — from $8.81 billion in 2025 to $9.66 billion in 2026. Income levels in both years exceed the $4.9 billion annual average from 2020 to 2024.
Government payments and livestock receipts contribute most to the projected income growth from 2025 to 2026. The government payments reaching Kansas farms in 2025 and 2026 compensate producers for losses incurred in earlier years. Read more of the outlook.
How farms use added income varies by operation. Work that we have done in cooperation with RaFF suggests higher net farm income levels in Kansas have coincided with more farms staying current on debt obligations.
The first chart shows changes in net farm income and safety net payouts relative to at-risk rates for ag production loans and loans secured by farmland. The at-risk rates represent farm loan stress. Higher at-risk rates suggest more of the Kansas farm loan portfolio in total has had repayment challenges.
According to our estimates, the at-risk rate for Kansas ag production loans — those that finance purchases including inputs and equipment — dropped notably in 2025 (0.17%) and 2026 (0.1%) as total statewide net farm income rose. For loans secured by farmland, the at-risk rate stayed elevated in 2025 (0.78%) before declining in 2026 (0.18%).
For 2025 and earlier years, the at-risk rates reflect call data that lenders publicly report. We use the 2026 farm income outlook from RaFF to model 2026 at-risk rates. Note, the at-risk rates shared here account for loans held only by commercial banks and Farm Credit institutions — lenders that extend roughly 80% of farm debt nationwide. Given this caveat, these rates pertain to a loan portfolio that has/had $7.5 billion in agricultural production loans and $10.7 billion in loans secured by farmland in 2025. Read more about the method used to compute at-risk rates in RaFF Policy Brief 2026-10(1).
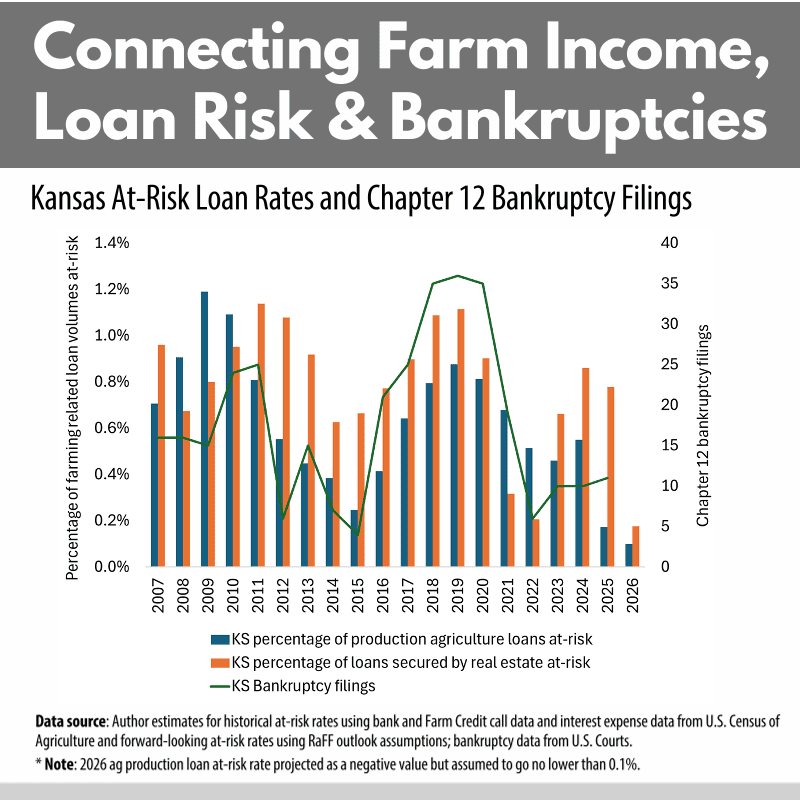
The at-risk rates importantly serve as an indicator of chapter 12 (farm) bankruptcies. The second chart shows the strong positive correlation between chapter 12 bankruptcy filings and joint levels of at-risk agricultural production loans and loans secured by farmland. At-risk rates staying low suggests a reduced likelihood of losing farms to bankruptcy.
Gateway to Credit: Trend in Total FSA Obligations Driven by Farmland Financing
June 10, 2026
By: Joe Parcell, Jennifer Ifft, Alice Roach
As farm finances tighten, we have monitored multiple sources for financial stress indicators. Because loans from the USDA Farm Service Agency (FSA) often reach borrowers who cannot otherwise obtain sufficient credit from banks or other lenders, an increase in FSA loan obligations may suggest farm-level credit constraints.
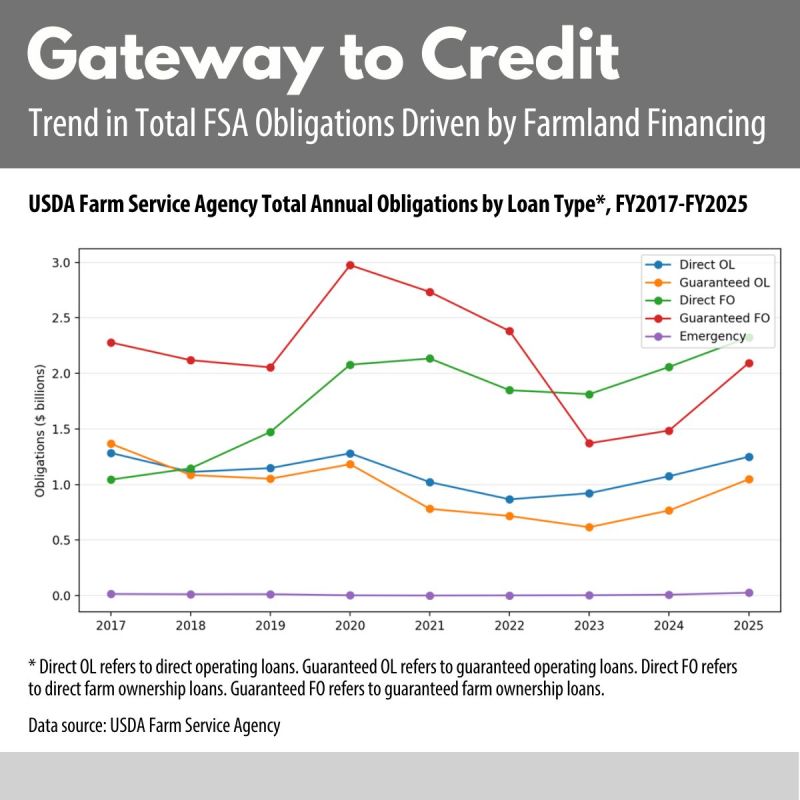
Based on publicly reported data for the U.S., total FSA obligations rose from about $6 billion in FY2017 to $7.5 billion in FY2020. They then declined to $4.7 billion in FY2023 before rebounding to $6.7 billion in FY2025.
This chart shows the FY2020 peak in total FSA obligations primarily stemmed from large increases in direct farm ownership and guaranteed farm ownership obligations. The FY2023 trough appears to reflect a sharp contraction in guaranteed farm ownership obligations, which had some increase in FY2024 and a stronger increase in FY2025.
FSA finances and services direct loans. A rise in direct obligations may point to more constrained borrower access to conventional credit.
On the other hand, FSA “backs” guaranteed loans — essentially providing a safety net to approved lenders in case principal and interest cannot be recouped. With guaranteed loans, the lender (e.g., bank, Farm Credit institution) maintains the relationship with the borrower. A rise in guaranteed obligations may indicate greater lender risk-sharing needs.
Gateway to Credit: Farm Ownership Loans Lead in States with Greater FSA Obligations
June 10, 2026
By: Joe Parcell, Jennifer Ifft, Alice Roach
As a “lender of first opportunity,” the USDA Farm Service Agency (FSA) provides credit to eligible farm borrowers who may not qualify for financing from banks or other lenders. FSA lending trends, therefore, can approximate the extent of farm credit constraints.
In a previous post, we recapped year-over-year U.S. loan obligations reported by FSA. As a complement to the national analysis, we reviewed state-level FSA loan obligation data to understand where farms have had the greatest need for credit access support.
FSA loan obligations have tended to concentrate within Corn Belt, Plains and Delta or Southern states. In these areas, farm scale, land values, operating costs and commodity exposure create large recurring credit needs.
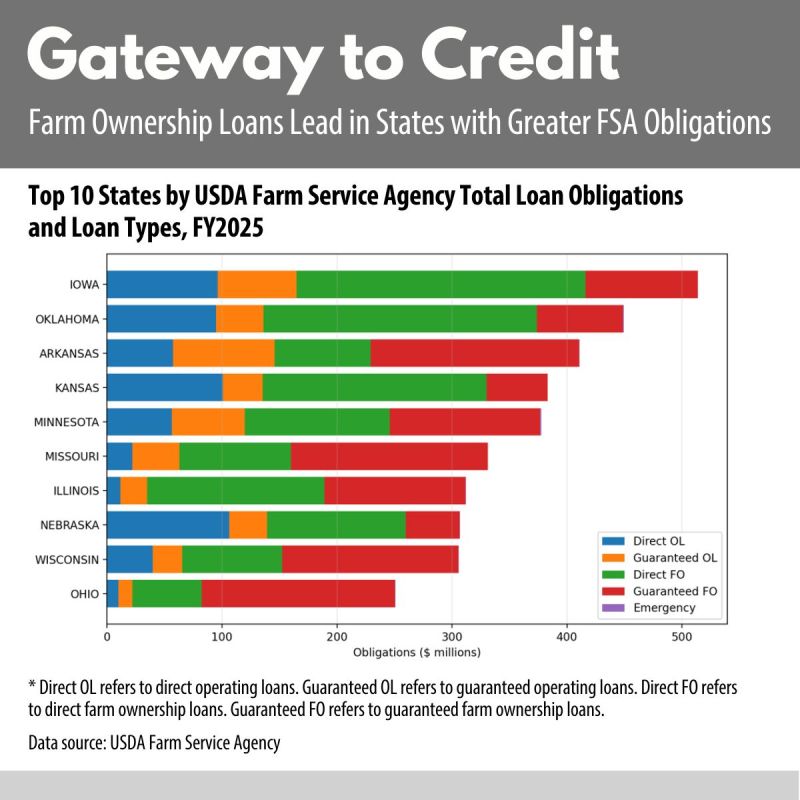
For the top 10 states based on FY2025 loan obligations data, the chart shows farm ownership loans dominated the obligation mix. States including Iowa, Oklahoma and Kansas had more direct farm ownership loan obligations than guaranteed farm ownership loan obligations. The opposite was true for states including Arkansas, Missouri and Wisconsin.
The distinction between direct and guaranteed matters because direct loans may indicate borrowers needing to rely on FSA as the primary lender. Guaranteed loans involve commercial lenders that manage risk through a “guarantee” provided by the federal government.
On average, ownership-related loans made up nearly two-thirds of total FSA obligations in FY2025. Direct farm ownership loans accounted for roughly 34.5% of all obligations, and guaranteed farm ownership loans accounted for about 31.1%. Direct operating loans represented about 18.5% of FY2025 obligations, and the guaranteed operating share reached about 15.5%.
Gateway to Credit: Iowa, Oklahoma and Minnesota Rank as Top 3 States for Average FSA Loan Obligations in Recent Years
June 10, 2026
By: Joe Parcell, Jennifer Ifft, Alice Roach
We recently wrote about states where USDA Farm Service Agency (FSA) loan obligations tallied the greatest amounts in FY2025. We analyzed the obligations data to understand geographic differences in farms’ needs for credit access support.
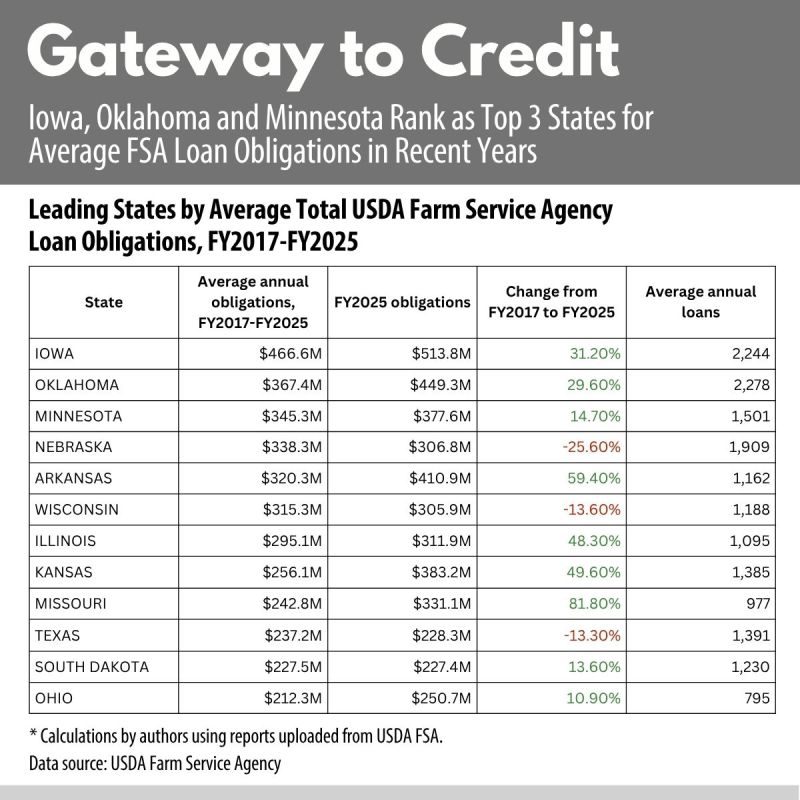
Observing multiyear averages instead of one year’s datapoints can tell more about where farms routinely have leaned on FSA for financing. Using FY2017 to FY2025 data, the table ranks states by their annual average FSA loan obligations. Iowa, Oklahoma and Minnesota averaged the greatest obligations during this multiyear period, whereas considering FY2025 data alone, the top three states for FSA loan obligations were Iowa, Oklahoma and Arkansas.
From FY2017 to FY2025, FSA loan obligations in dollar terms grew the most in Missouri (81.8%), Arkansas (59.4%), Kansas (49.6%) and Illinois (48.3%). A rise in obligations could indicate producers in a state relying more on FSA in place of other lenders to satisfy credit needs or greater credit needs altogether.
In terms of number of loans, not their value, Oklahoma, Iowa and Nebraska had the greatest annual average count of FSA loans between FY2017 and FY2025. Ohio and Missouri had the least on average.
These trends suggest financial stress and credit demand are not static across agricultural regions. They also motivate further study into credit conditions at the subnational level.
Examining Cost of Funds and Farm Loan Interest Rates by Lender Type
September 22, 2026
By: Jennifer Ifft with Noah Miller, Chad Fiechter, Blaine Nelson, and Francisco Scott
In a recent RaFF policy brief and a paper, we summarize research into how lender type differences shape farm loan interest rates and the extent to which lenders pass along changes in loan-making costs to borrowers.
The charts summarize trends in interest rates and the cost of funds — the expense lenders incur to access money they lend to borrowers — for three lender types: commercial banks, Farm Credit lenders, and nontraditional lenders such as vendors. The analysis used median interest rates from the USDA Agricultural Resource Management Survey for loans that originated between 2005 and 2023, for farms reporting at least two loans during that period. These points summarize trends in interest rates and cost of funds by lender type:
- The margin between bank interest rates and bank cost of funds has been wider in recent years, but rates and cost of funds had similar trends over time.
- For Farm Credit lenders, cost of funds and interest rates were close — and sometimes showed an interest rate lower than the cost of funds — early in the study period. The two data series have followed similar trends in recent years. We could not account for patronage in this study, which factors into the ultimate cost of credit.
- Nontraditional lenders often have had a cost of funds that exceeds the interest rate they have charged, but the relationship generally narrowed in recent years. This could be one factor contributing to recent reported increases in vendor finance.
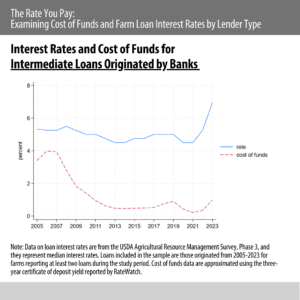
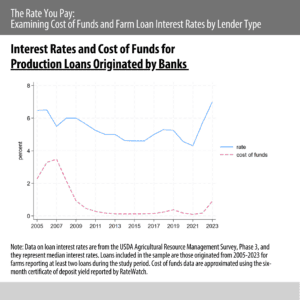
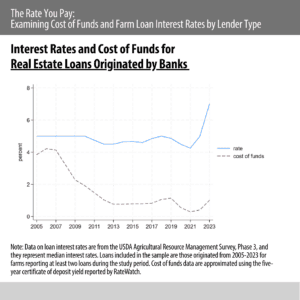
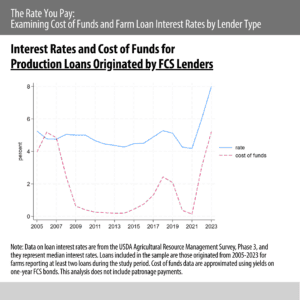
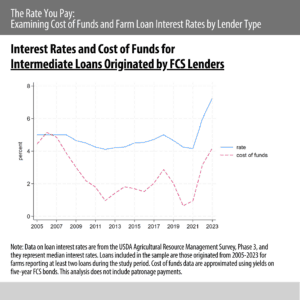
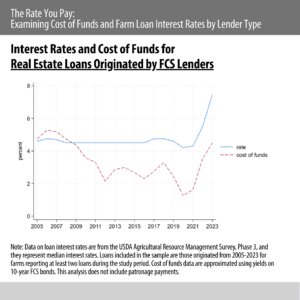
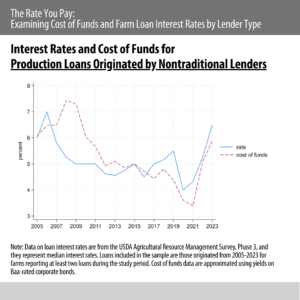
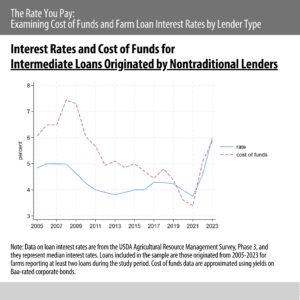
Interest rates charged on farm loans tend to differ by lender type. Different farm lenders have different sources of capital, incentives to supply credit, and regulatory frameworks.
Our regression analysis, which controlled for individual farm characteristics, found that interest rates increased by 0.06 percentage points on average for every percentage point increase in the cost of funds. This relatively low pass-through may be due to factors such as borrower characteristics (e.g., risk profile) playing a primary role in rate-setting, as well as generally low interest rates until the very end of our study period. We found some evidence that nontraditional lenders may be more sensitive to changes in the cost of funds than Farm Credit lenders. Banks seem slightly less responsive.
In more concentrated credit markets, or, in other words, markets with fewer lenders, lenders tended to pass through a smaller share of cost-of-funds changes, but this finding could be attributed to unobserved characteristics of different markets.
For Farm Credit Institutions, Multi-Lender Partnerships Enable Serving Larger Borrowers and Diversifying Risk
October 1, 2026
By: Jennifer Ifft, Joe Parcell, and Alice Roach
As farms get larger, so can their loans, and some loans can be too large for a single lender to take on. This has provided the opportunity for more lenders to work together — both to serve larger borrowers and diversify risk.
When lenders partner on loans, they can spread financial exposure across regions, industry sectors and loan classifications. Partnering can also allow lenders to take a stake in loans they could not absorb completely on their own.
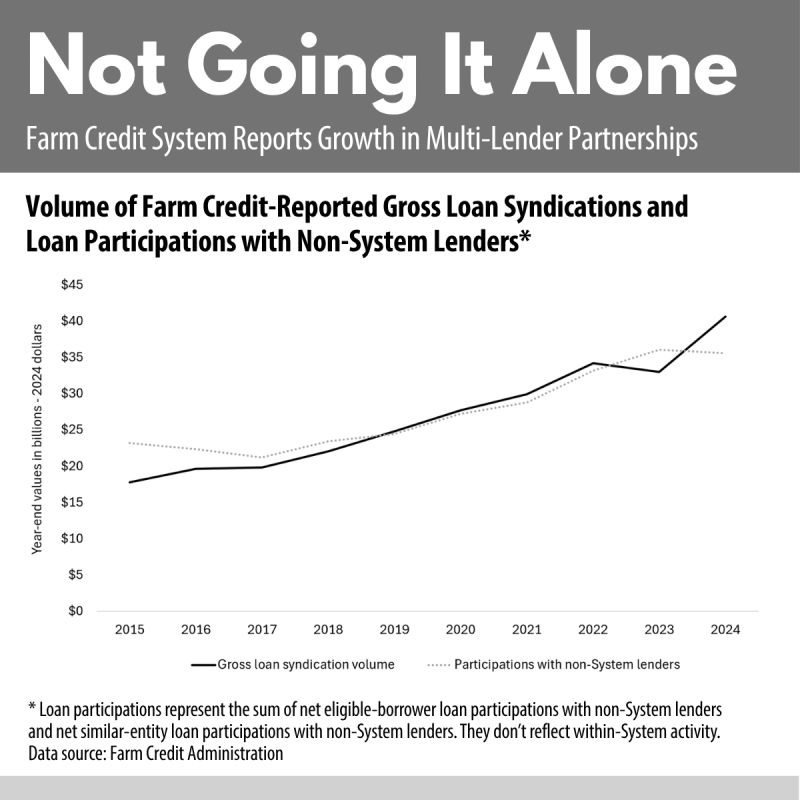
Through syndications and participations, Farm Credit institutions collaborate with one another and non-Farm Credit lenders to source the credit sought by farm and agribusiness borrowers. In inflation-adjusted dollars (2024=100), the chart below shows the extent to which syndication and participation volumes changed from 2015 to 2024. To provide perspective on the scale of these lending strategies, the Farm Credit Administration reported that gross loans outstanding summed to $428.9 billion in 2024. The reported syndication and participation volumes represent a sizable and growing share of Farm Credit business.
- Gross loan syndication volume more than doubled during the observed decade and totaled $40.6 billion in 2024. Through a syndication, multiple institutions supply credit for a large loan. Each enters into a contract with the borrower, who must have voting stock in the Farm Credit lenders engaging in the syndicated loan. A lead lender usually takes responsibility for coordinating with the borrower. Syndications show how large loans have become more common.
- Net participations with non-System lenders also increased. They represent the net of similar-entity loans purchased minus similar-entity loans sold, where one lender originated a loan, but at least one other lender outside of the Farm Credit System acquired or sold part of that loan. The Farm Credit Administration reports the volume of net participations with non-System lenders increased by 53% from 2015 to 2024. The growth suggests that participations allow Farm Credit institutions to expand their businesses, likely diversify geographically and open new lending relationships that support agriculture and agribusinesses beyond owner-members.
Growth in these measures points to an evolving agricultural credit landscape. Lenders may realize they can do more business by working collectively, lower their portfolio risk and meet the needs of increasingly larger farms and agribusinesses. For farms that have outgrown a single lender, syndications and participations represent a pathway to secure the credit they need.
Signup For Our Email Announcements
