
Note: Data on loan interest rates are from the USDA Agricultural Resource Management Survey, Phase 3, and they represent median interest rates. Loans included in the sample are those originated from 2005-2023 for farms reporting at least two loans during the study period. Cost of funds data are approximated using the six-month certificate of deposit yield reported by RateWatch.
Lender Costs, Market Structure and Farm Loan Rates
RaFF Policy Brief 2026-9(1)
By: Noah Miller, Chad Fiechter, Jennifer Ifft, and Blaine Nelson
September 1, 2026
This policy brief summarizes research that explores how changes in cost of funds — the expense lenders incur to source money used to finance loans — affect agricultural loan interest rates.
Download Printable Policy Brief (PDF)Background
In recent years, farms have experienced higher interest rates charged on new, refinanced and variable-rate loans. Monetary policy decisions meant to manage inflation and other economic forces have placed upward pressure on interest rates. For borrowers, the higher rates translate into higher interest payments and possibly greater challenges to repay debt when cash flow tightens.
For decades, the federal government has championed credit access for farms, and various policies have supported loan-making across major types of agricultural lenders, including Farm Credit System (FCS) institutions, the USDA Farm Service Agency and commercial banks. Each lender type has varying regulatory frameworks, sources of capital, incentives to supply credit and preferences for borrowers.
Until now, little research has explored the extent to which these differences shape the interest rates each lender type charges and the amount of loan-making costs each type passes to borrowers. The research summarized in this brief examines the effect that changes in the cost of funds — the expense that lenders incur to access money used to fund loans — has on agricultural loan interest rates. Specifically, the analysis assesses this relationship for three major lender types (i.e., commercial banks, Farm Credit institutions and nontraditional lenders such as vendors) and investigates whether this relationship varies based on local credit market competition.
Methodology
The study compared interest rates on loans made to the same farm by different types of lenders. This approach “nets out” the influence of borrower and other farm-specific characteristics, such as management skill and productivity, that are relatively stable over time. Two important modeling choices support the methodology. First, the dataset focuses on individual loans reported to the USDA Agricultural Resource Management Survey (ARMS) by farm respondents with multiple loans across the lender types. Second, the analysis constructed lender type-specific forward-looking proxies for the cost of funds using the following procedures:
- Commercial banks often rely on deposits to fund loans. The banks pay interest to the depositors in exchange for using the depositors’ money. This study assumed that reported yields on certificates of deposits (i.e., six-month certificate of deposit yields for operational loans, three-year certificate of deposit yields for intermediate loans and five-year certificate of deposit yields for real estate loans) represent the cost of funds for all loan types.
- Farm Credit institutions generally receive funds for loan-making when the Federal Farm Credit Banks Funding Corporation issues bonds to investors. After selling bonds, the funds funnel to the four Farm Credit banks and then to the associations extending loans to individual producers. This research assumes average annual yields for one-, five- and 10-year bonds serve as proxies for the cost of funds incurred for operating, intermediate and real estate loans, respectively.
- Nontraditional lenders, including implement dealers and input suppliers, typically generate funds for loan-making by issuing debt or equity. In the ARMS data, these lenders most often extended intermediate loans to finance equipment. This research assumes an average annual Baa-rated bond yield represents a typical cost of funds for nontraditional lenders.
To evaluate the relationship of local credit market competition with rate-setting, the study computed a Hirschman-Herfindahl Index (HHI) for commercial banks, which are likely the marginal lender in agricultural credit markets. HHI compares a bank branch’s deposits in a county with the county’s total deposits. In a more concentrated credit market (i.e., high HHI), relatively few banks handle a relatively large share of deposits. This research formed three concentration levels based on terciles of the HHI distribution.
Data
The study used a subset of farm loan data collected in the Phase 3 ARMS data collection, which is an annually recurring, nationally representative survey of U.S. farms. Loan-related variables captured in the survey include interest rate, loan type (i.e., production, intermediate, real estate), lender type, loan term and origination year. Using annual data from the 2008 to 2023 surveys, the research restricted the analysis to loans originated by the three lender types after 2005. Applying these parameters to the dataset provided 138,116 farm loan records from 43,469 farms.
Data sources used to approximate the cost of funds varied by lender type. Certificate of deposit yields used to approximate a commercial bank’s cost of funds were derived as annual averages of daily RateWatch data reported by Bloomberg. For bonds issued by the Federal Farm Credit Banks Funding Corporation, annual averages of weekly Funding Cost Index provide their average yields. Annual averages of monthly Baa-rated bond yields assumed to represent nontraditional lenders’ cost of funds were sourced from the St. Louis Federal Reserve FRED data repository.
The HHI values used to assess local credit market competition were computed using annual summary of deposits data from the Federal Deposit Insurance Corporation.
Results
The figures in the appendix (Figures A1-A8) summarize trends in the cost of funds and median interest rates for the three loan types (i.e., production, intermediate, real estate) originated by the three lender types.[1] For banks, the margin between interest rates and cost of funds has been wider in recent years relative to nearly two decades ago, but rates and cost of funds had similar trends over time. For Farm Credit lenders, cost of funds and interest rates were close — and sometimes showing a lower interest rate than cost of funds — early in the study period, but the two data series have followed similar trends in recent years. Nontraditional lenders often have had a cost of funds that exceeds the interest rate they have charged, but the relationship has generally narrowed in recent years.[2]
The regression analysis found lenders pass cost of funds changes to their borrowers to a small extent. Regression results find a 0.06 percentage point average increase in interest rates for every percentage point increase in the cost of funds. Passthrough activity does vary by lender type, though the extent of the passthrough varies according to the model used to approximate it. When setting interest rates on loans, nontraditional lenders appear more sensitive to changes in the cost of funds than Farm Credit lenders. Banks seem to be slightly less responsive to changes in the cost of funds.
Credit market competition is related to how much lenders pass through cost of funds changes to borrowers. Lenders passed through a smaller share of cost-of-funds changes in more concentrated, less competitive markets. This could stem from either competition or factors related to competition.
Several factors may explain the low cost of funds passthrough found in this study. Borrower characteristics beyond those controlled in the study (e.g., risk) may play a primary role. Interest rates were relatively low for most of the study period, so lenders may have been less sensitive to changes in the cost of funds. Further, credit market competition may be leading to lower passthrough than expected.
[1] Due to a low number of observations, no summary chart is provided for interest rates and cost of funds for real estate loans originated by nontraditional lenders.
[2] The nontraditional finance trend is consistent with recent findings that implicit lending rates offered by vendors for purchased seed have become more competitive with rates charged by other lender types. Read more at https://raff.missouri.edu/wp-content/uploads/2025/12/2025-12-1-RaFF-Policy-Brief.pdf.
Concluding Comments
This research shows that lenders pass on some changes in their funding costs to farm borrowers, but the response is modest and differs across lender types and local credit markets. Policies and lending strategies aimed at improving credit access or lowering borrowing costs may be less effective if differences among lenders and markets are ignored.
Future research should better isolate how lender competition affects the extent to which changes in lenders’ funding costs are passed on to borrowers. More work is also needed to understand how lender and borrower risk influence loan pricing. For FCS lenders, changes in funding costs may be reflected through patronage distributions rather than interest rates, highlighting the need for data that can examine both pricing channels.
Contact Information
Jennifer Ifft, Professor, Kansas State University: jifft@ksu.edu
Acknowledgements
The development of this report was supported in part by the U.S. Department of Agriculture, Office of the Chief Economist, Award ID 58-0111-23-017, and the U.S. Department of Agriculture, Economic Research Service. The findings and conclusions in this report are those of the authors and should not be construed to represent any official USDA or U.S. Government determination or policy.
Appendix
Figure A1. Interest Rates and Cost of Funds for Production Loans Originated by Banks
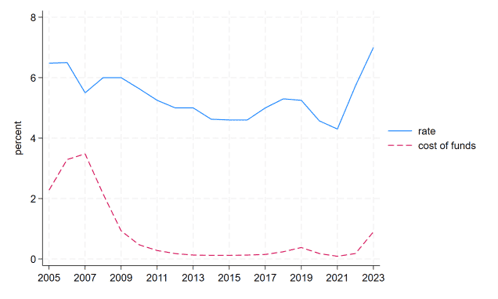
Figure A2. Interest Rates and Cost of Funds for Intermediate Loans Originated by Banks
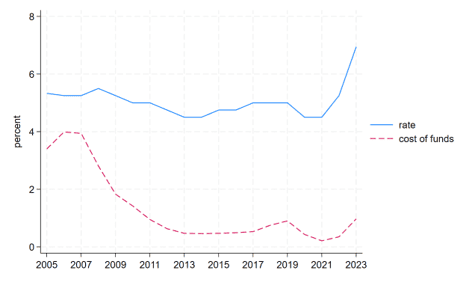
Note: Data on loan interest rates are from the USDA Agricultural Resource Management Survey, Phase 3, and they represent median interest rates. Loans included in the sample are those originated from 2005-2023 for farms reporting at least two loans during the study period. Cost of funds data are approximated using the six-month certificate of deposit yield reported by RateWatch.
Figure A3. Interest Rates and Cost of Funds for Real Estate Loans Originated by Banks
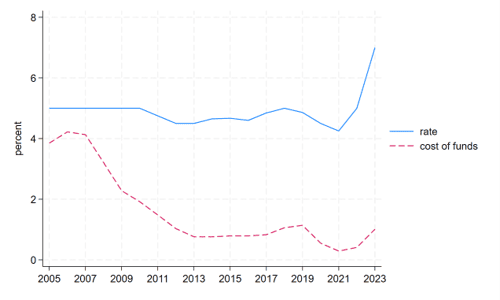
Note: Data on loan interest rates are from the USDA Agricultural Resource Management Survey, Phase 3, and they represent median interest rates. Loans included in the sample are those originated from 2005-2023 for farms reporting at least two loans during the study period. Cost of funds data are approximated using the five-year certificate of deposit yield reported by RateWatch.
Figure A4. Interest Rates and Cost of Funds for Production Loans Originated by FCS lenders
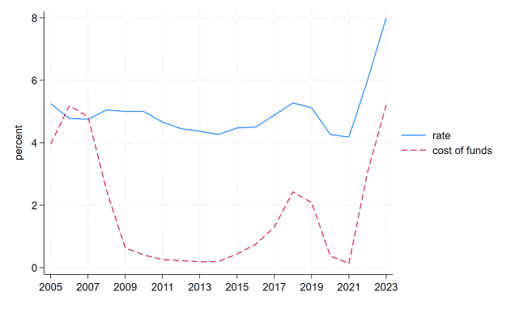
Note: Data on loan interest rates are from the USDA Agricultural Resource Management Survey, Phase 3, and they represent median interest rates. Loans included in the sample are those originated from 2005-2023 for farms reporting at least two loans during the study period. Cost of funds data are approximated using yields on one-year FCS bonds. This analysis does not include patronage payments.
Figure A5. Interest Rates and Cost of Funds for Intermediate Loans Originated by FCS Lenders
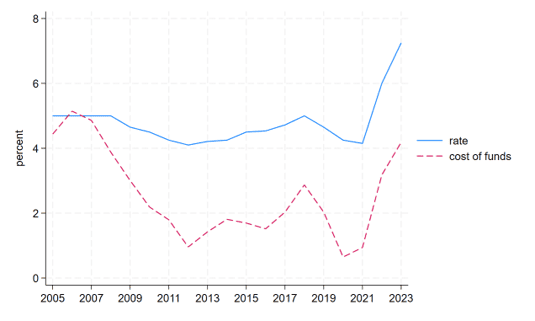
Note: Data on loan interest rates are from the USDA Agricultural Resource Management Survey, Phase 3, and they represent median interest rates. Loans included in the sample are those originated from 2005-2023 for farms reporting at least two loans during the study period. Cost of funds data are approximated using yields on five-year FCS bonds. This analysis does not include patronage payments.
Figure A6. Interest Rates and Cost of Funds for Real Estate Loans Originated by FCS Lenders
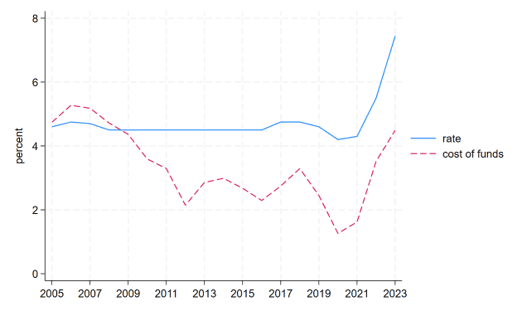
Note: Data on loan interest rates are from the USDA Agricultural Resource Management Survey, Phase 3, and they represent median interest rates. Loans included in the sample are those originated from 2005-2023 for farms reporting at least two loans during the study period. Cost of funds data are approximated using yields on 10-year FCS bonds. This analysis does not include patronage payments.
Figure A7. Interest Rates and Cost of Funds for Production Loans Originated by Nontraditional Lenders
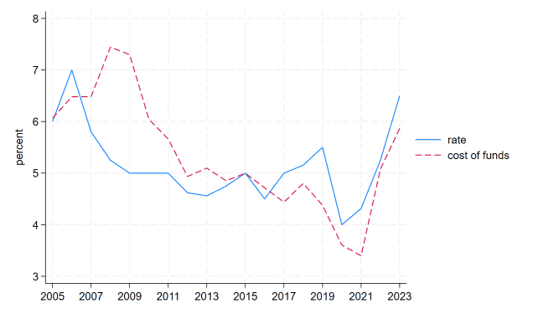
Note: Data on loan interest rates are from the USDA Agricultural Resource Management Survey, Phase 3, and they represent median interest rates. Loans included in the sample are those originated from 2005-2023 for farms reporting at least two loans during the study period. Cost of funds data are approximated using yields on Baa-rated corporate bonds.
Figure A8. Interest Rates and Cost of Funds for Intermediate Loans Originated by Nontraditional Lenders
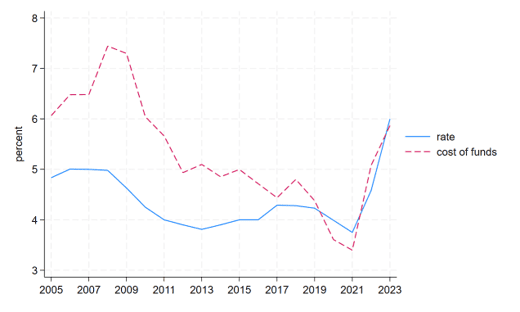
Note: Data on loan interest rates are from the USDA Agricultural Resource Management Survey, Phase 3, and they represent median interest rates. Loans included in the sample are those originated from 2005-2023 for farms reporting at least two loans during the study period. Cost of funds data are approximated using yields on Baa-rated corporate bonds.
References
Miller, N., Fiechter, C., Ifft, J., Nelson, B., & Scott, F. (2026). How Lender Cost of Funds and Market Structure Shape Agricultural Interest Rates. Applied Economic Perspectives and Policy. https://doi.org/10.1002/aepp.70091.
Recommended citation format: Miller, N., Fiechter, C., Ifft, J., and Nelson, B. “Lender Costs, Market Structure and Farm Loan Rates.” RaFF Policy Brief 2026-9(1), Rural and Farm Finance Policy Analysis Center, University of Missouri, Columbia. Sep. 1, 2026. Available at raff.missouri.edu.
Signup For Our Email Announcements
