
TEST_RaFF’s Leading Indicators of Farm Financial Stress: Spring 2026_v1: T&F at the end
RaFF Report 2026-EWS-2
Jennifer Ifft, Joe Parcell and Alice Roach
April 30, 2026

Referencing data published through early spring 2026, the indicators tracked in this policy brief help to understand the farm sector’s financial position and identifying emerging farm economic stresses.
Download Full Report (PDF)Introduction
Grouped in four classes, the 15 indicators monitored in this brief evaluate the state of farmer and banker sentiment, farm income and balance sheet health, farm machinery market dynamics and credit quality. In cases where indicators suggest emerging stresses, the data can help inform responses and broader discussions about those conditions.
Panelist Summary
To interpret the indicators, RaFF engages an expert panel of economists who have market outlook, farm management or farm finance specialties.[1] On average, the panelists participating this spring perceived the farm economy overall and the four indicator classes to have moderate risk levels. Table 1 shows the farm machinery market and the farm income and balance sheet health classes ranked as the indicators with the highest risk levels. The credit quality class averaged the lowest risk level score.
The momentum measures in the table suggest panelists perceived nearly all indicator classes to have at least slightly deteriorating momentum. The panelists noted no change collectively in the underlying indicators for the farmer and banker sentiment class
Table 2 shows little change in the average risk levels submitted in the winter 2026 panelist survey and the spring 2026 panelist survey. Average perceived risk declined slightly for farmer and banker sentiment, the farm machinery market, credit quality and the farm economy in aggregate. It increased for the farm income and balance sheet health.
Note, the momentum measure in Table 1 indicates perceptions panelists shared in spring 2026 about the extent to which indicators have changed in the most recent period with data reported compared with the prior period when data were updated. In contrast, the change in average risk ratings shown in Table 2 represent how the spring 2026 average risk levels reported in Table 1 compare with the winter 2026 risk levels. Both measures suggest small changes in underlying farm financial indicators, but only for the farm income and balance sheet health class did the momentum score and risk level change in the same direction.
By evaluating multiple indicators, this brief avoids a single indicator possibly misrepresenting the farm sector’s overall financial position. That said, the selected indicators do not completely address financial performance differences by sector (e.g., row crops, specialty crops, beef cattle, dairy). Instead, they represent aggregate or average conditions.[2]
The following summary of indicators is provided by the brief’s authors, not the expert panelists.
Farmer & Banker Sentiment
Sentiment about farm loan repayment rates improved during the fourth quarter of 2025, according to lender responses recorded in the Federal Reserve Bank of Kansas City’s quarterly agricultural credit conditions survey. The loan repayment index shown in Figure 1 increased to 91 in the fourth quarter of 2025 from 73 in the third quarter. Not since the fourth quarter of 2023 had the index exceeded 90 points. That said, during fourth-quarter 2025, the index still registered a value slightly lower than 100 — indicating some decline in repayment conditions. The loan renewals or extensions index declined slightly to 127 during the fourth quarter of 2025 compared with 130 in the third quarter. It being greater than 100, however, signals growth in loan renewals or extensions.
Farmer sentiment captured in the March 2026 iteration of the Purdue University-CME Group Ag Economy Barometer suggests stronger perceived current conditions and future expectations relative to earlier in the year. Figure 2 shows both index values rose from January 2026 to March 2026 — by 17 points for current conditions and 13 points for future expectations. Despite these improvements, both index values were not as high in March 2026 as they were in March 2025.
Farm Income & Balance Sheet Health
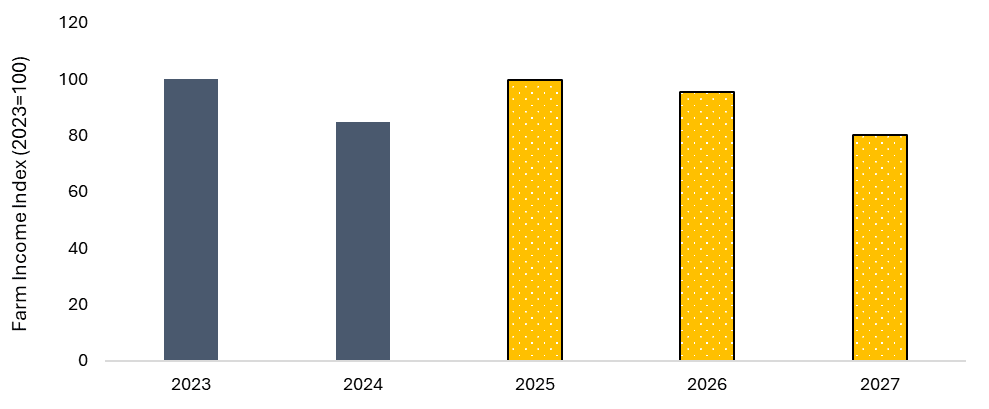
In its spring 2026 agricultural market outlook, the Food and Agricultural Policy Research Institute (FAPRI) at the University of Missouri projected real U.S. net farm income would decrease slightly from 2025 to 2026. Using farm income data reported in 2026 dollars, Figure 3 displays a net farm income index with 2023 net farm income as the base value. It shows comparable income values for 2023 and 2025. The 2026 projection is 96% of the 2023 value. The 80% index value for 2027 indicates a 20% decline in real U.S. farm income relative to 2023.
The farm sector’s cash position affects whether farms can stay current on paying obligations. As a cash-based farm financial measure, net cash farm income exclusively reflects cash receipts and expenses. Figure 4 highlights differences in net cash farm income by farm specialization using data from the USDA Economic Research Service. According to projections released in February 2026, net cash farm income for the average U.S. farm business[3] will increase by 16.5% from 2025 to 2026 after declining slightly (-2.2%) from 2024 to 2025. Of the four specialized farm types tracked in the chart, the projections point toward a net cash farm income contraction from 2025 to 2026 for hog and dairy farm businesses at -4.1% and -2.8%, respectively. On average, farm businesses specializing in corn production have a relatively large 36.6% projected increase in net cash income from 2025 to 2026. For farms specializing in specialty crops, the average net cash farm income growth is projected to increase slightly. As these data suggest, financial performance can vary greatly across farm specializations, so measures that summarize the farm economy overall may miss conditions experienced by certain farm types.
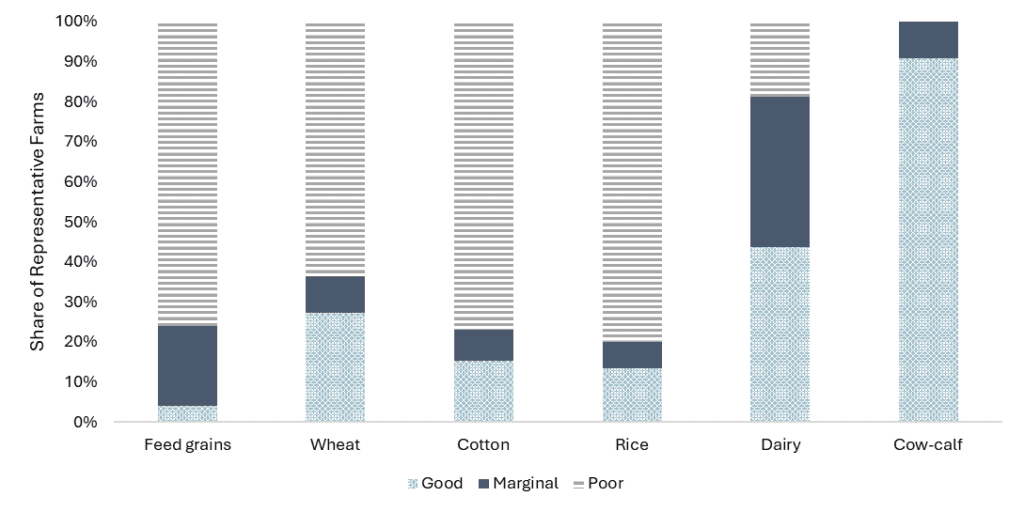
To further explore financial conditions by farm specialization, the Agricultural and Food Policy Center (AFPC) at Texas A&M University simulates farm financial conditions through its representative farms project. Using inputs from FAPRI’s outlook, each representative farm fits in a category based on its overall financial position. The classifications[4] convey the chances that farms post a cash flow deficit and lose real net worth. “Good” suggests a less than 25% chance, “marginal” means a 25% to 50% chance, and “poor” indicates a greater than 50% chance. Given the 2026 projections, the 2031 classifications suggest a majority of crop operations will have poor financial conditions. Figure 5 highlights livestock operations expect better conditions compared with crop farms. Roughly one in five representative dairy farms are projected to have poor financial conditions. The representative farms report identified only good or marginal conditions for cow-calf operations.
About the Indicators
The Leading Indicators of Farm Financial Stress initiative tracks 15 data-driven financial indicators organized in four classes to evaluate the farm sector’s financial health. RaFF publishes leading indicators summary briefs on a quarterly basis. It released the winter 2026 brief in January 2026, and RaFF anticipates it will release the summer 2026 brief in July 2026.
The risk ratings and year-over-year change assessments shown in Table 1 reflect data interpretations provided by an expert panel of public- and private-sector economists who have market outlook, farm management or farm finance specialties. Each quarter, as many as 22 participating economists review the underlying datasets and offer their individual input about the indicators’ risk and trend for the farm sector on a 1-to-10 scale (i.e., risk level scale ranges from 1 = low risk to 10 = high risk; period-over-period change scale[5] ranges from 1 = significant deterioration to 10 = significant improvement). They provide ratings for each indicators class and the farm economy overall. Table 1 reports the economists’ collective view of the farm economy
[1] For more about the panel, see this brief’s “About the Indicators” section.
[2] Developing a more complete understanding of farm financial health requires approximating the share of farms facing financial difficulties or gauging whether certain farms, such as those owned by beginning operators, face greater financial stress than others. More disaggregated farm financial information is available from the USDA Economic Research Service farm income forecast, USDA Agricultural Resource Management Survey responses, RaFF state-level farm income outlooks and FINBIN from the University of Minnesota’s Center for Farm Financial Management.
[3] A farm business makes more than $350,000 in gross cash farm income or has an operator whose primary occupation is farming, according to the USDA Economic Research Service.
[4] Classifications are based on negative ending cash (i.e., cash flow deficit) and real net worth decline (i.e., loss in real net worth relative to beginning net worth) probabilities.
[5] Scale has been adjusted to range from -10 to 10 to create the summary graphic shown in Table 1.
Farm Income Glossary
net cash income
reflects difference between cash receipts and expenses
net farm income
equals net cash income plus the value of home consumption, change in inventories, capital replacement and implicit rent and expenses related to the farm operator’s dwelling that are not reflected in cash transactions during the current year
Tables & Figures
Table 1. Spring 2026 Leading Indicators Summary*^
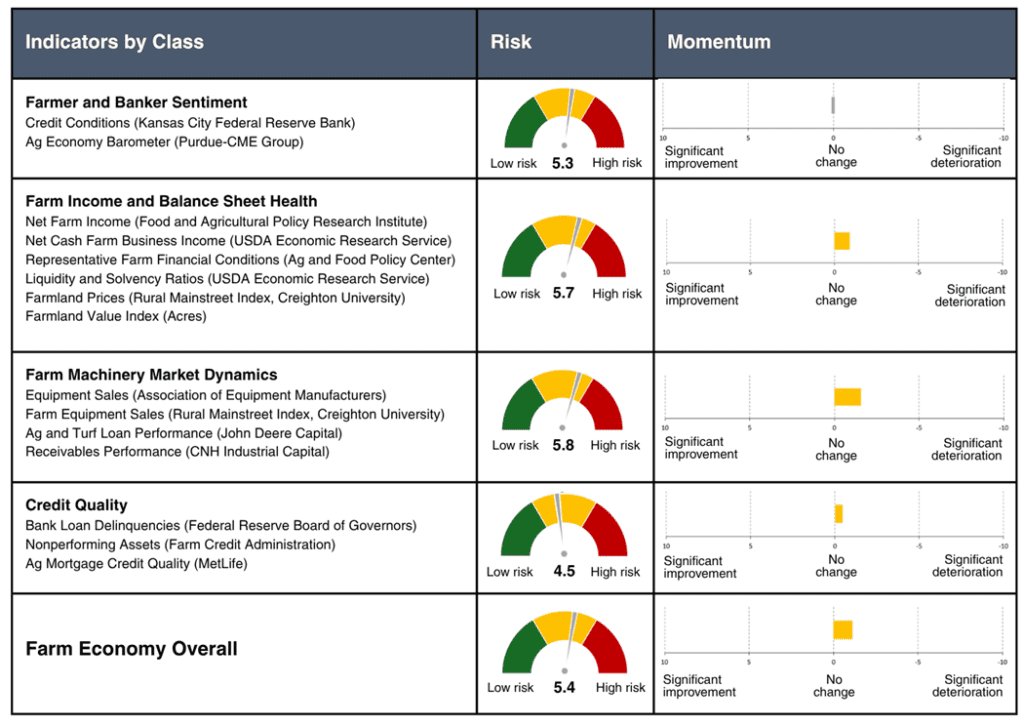
* Risk stated on a 1 to 10 scale where 1 means low risk and 10 means high risk.
^ Momentum presented on a scale where -10 means significant deterioration and 10 means significant improvement. It measures change in data values since the prior period when data were updated. Note, some indicators are published on a monthly or quarterly basis. Others are updated less frequently
Table 2. Current and Previous Quarter Risk Level Comparisons*
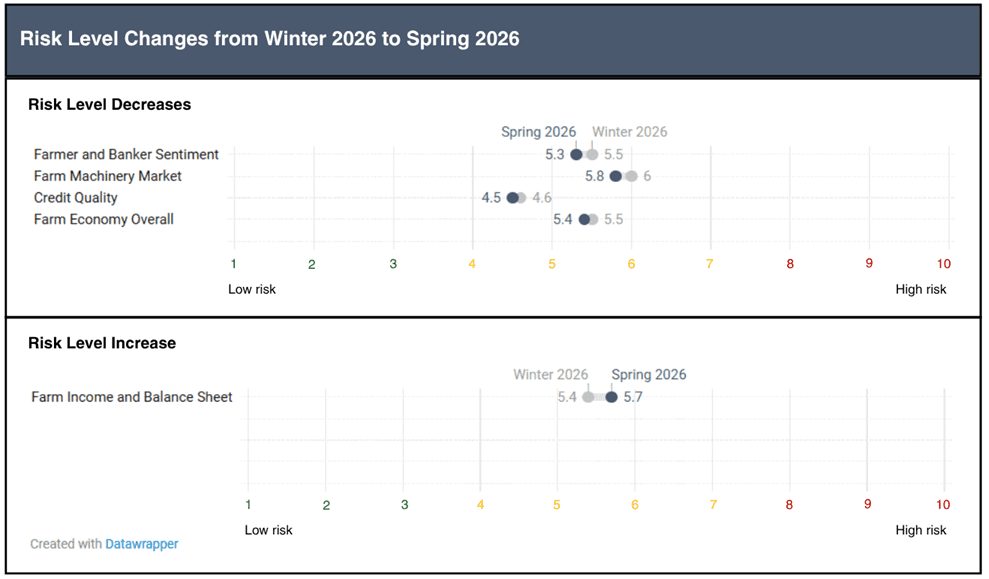
* Risk stated on a 1 to 10 scale where 1 means low risk and 10 means high risk.
Figure 1. 10th Federal Reserve District Agricultural Credit Conditions
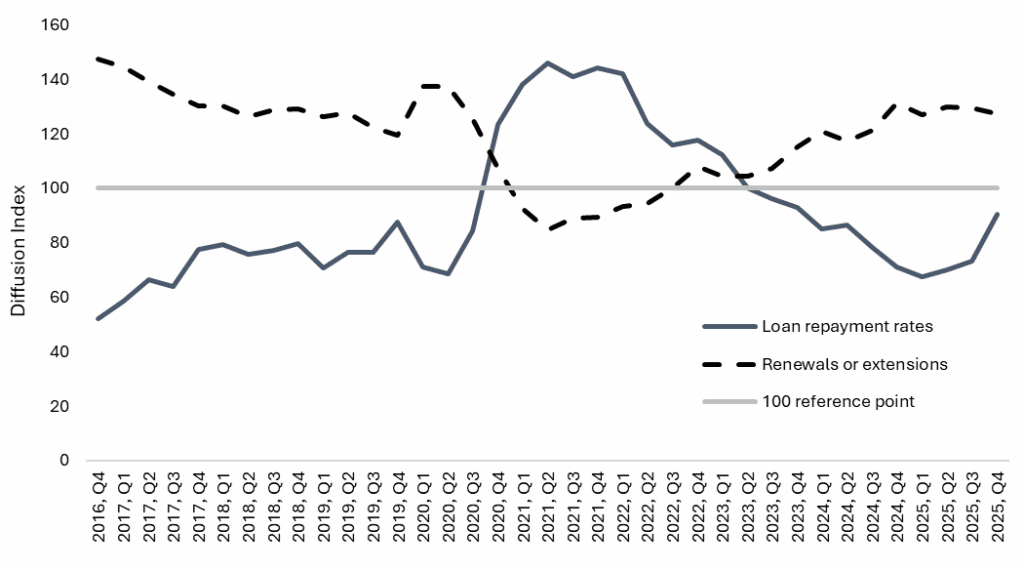
Note: Data updated through Feb. 11, 2026, data release.
Source: Kansas City Federal Reserve Bank (https://www.kansascityfed.org/agriculture/ag-credit-survey/credit-conditions-tighten-gradually/). Diffusion index prepared by subtracting the share of respondents responding that conditions are lower than in the year-earlier period from the share responding that conditions are higher and adding 100. Values greater than 100 suggest an increase in activity, and those less than 100 suggest a decline in activity.
Figure 2. Farmer Sentiment about Current Conditions and Future Expectations
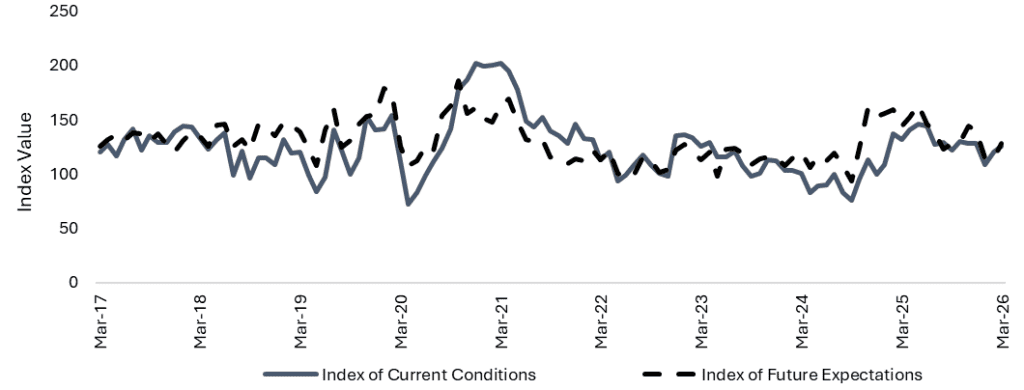
Note: Data updated through April 7, 2026, data release.
Source: Purdue University-CME Group Ag Economy Barometer (https://ag.purdue.edu/commercialag/ageconomybarometer/). Data updated in April 2026 with sentiment from March. Values greater than 100 suggest an increase in sentiment relative to the base period (i.e., October 2015 to March 2016), and those less than 100 suggest a decline in sentiment.
Figure 3. U.S. Net Farm Income Index Computed Using 2026 Dollars*^
Note: Data updated through March 26, 2026, data release.
* Shading with the gold pattern indicates datapoints are projections. Dark blue shading indicates historical data.
Source: Food and Agricultural Policy Research Institute (https://fapri.missouri.edu/our-publications/)
Figure 4. Average Net Cash Farm Income, Real* Dollars, All Farm Businesses and Select Specializations
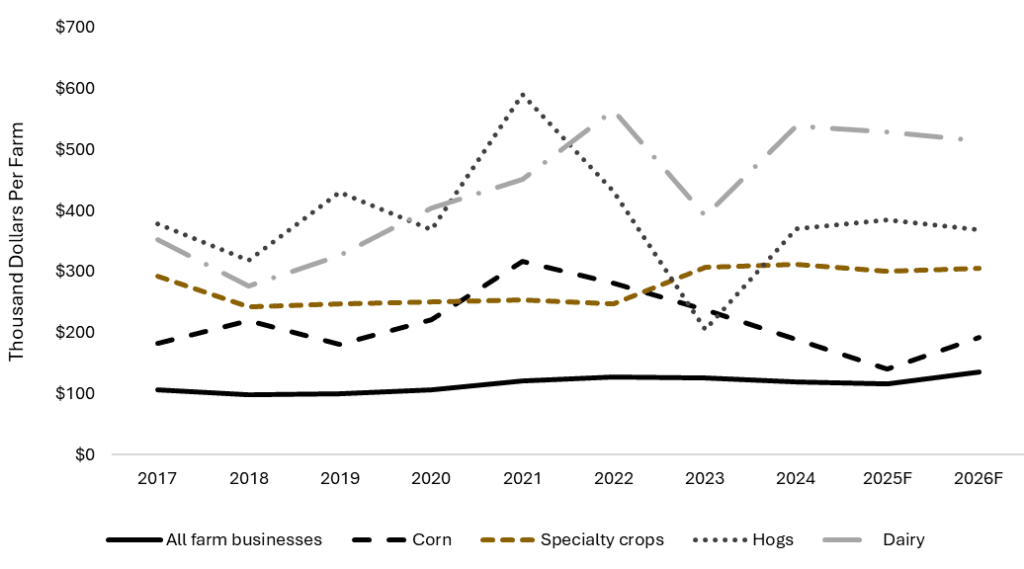
* Real dollars are 2026 dollars.
Source: USDA Economic Research Service (https://data.ers.usda.gov/reports.aspx?ID=4046).
Figure 5. Projected Financial Conditions for Representative Farms, 2026-2031
Source: The Agricultural and Food Policy Center at Texas A&M University (https://afpc.tamu.edu/research/publications).
Contact Information
Jennifer Ifft, Kansas State University, jifft@ksu.edu
Joe Parcell, Kansas State University, jparcell@ksu.edu
Alice Roach, Kansas State University, aliceroach@ksu.edu
Acknowledgements
The development of this Policy Brief was supported by the US Department of Agriculture, Office of the Chief Economist, Award ID 58-0111-24-019. The findings and conclusions in this report are those of the authors and should not be construed to represent any official USDA or US Government determination or policy.
Signup For Our Email Announcements
