
TEST_ A Review of Recent Farm Income Outlook Reports: Spring 2026
RaFF Policy Brief 2026-5(2)
By: Oranuch Wongpiyabovorn and Alejandro Plastina
May 12, 2026
The goal of this policy brief is to provide (i) a summary of national trends in farm income
projections, (ii) a summary of the ten state-level farm income projections for 2026 by RaFF
and collaborators, and (iii) a discussion of major potential sources of uncertainty for the U.S.
agricultural sector.
Farm Income Projections
The Rural and Farm Finance Policy Analysis Center (RaFF) at the University of Missouri, in collaboration with experts from multiple land-grant universities, has recently released Spring 2026’s deterministic projections of net farm income (NFI) for 10 states: Arkansas, Illinois, Indiana, Iowa, Kansas, Minnesota, Missouri, Nebraska, North Dakota, and Texas. The reports with the accompanying tables are available at https://raff.missouri.edu/state-outlooks/. They are intended to supplement national projections developed by the U.S. Department of Agriculture Economic Research Service (USDA-ERS) and the Food and Agriculture Policy Research Institute at the University of Missouri (FAPRI-MU) that inform policymakers, agricultural stakeholders, and the general public about the evolution of the farm economy.
While the latest NFI projections from USDA-ERS (2026) were released on February 5, 2026, those from FAPRI-MU (2026) were published on March 26, 2026. Both projections were completed prior to the escalation of the ongoing conflict in the Strait of Hormuz and do not reflect the observed increases in fuel and fertilizer prices. In contrast, RaFF’s NFI projections incorporate information on rising input costs as of April 2026. However, it is important to distinguish between input costs, such as the price per gallon of diesel or the price per ton of urea fertilizer, and expenditures on inputs of production, which are affected not only by unit costs but also by the number of units of inputs used in production. When input costs increase, producers tend to reduce the usage of the more expensive inputs. As producers adjust their production practices to reduce input use and shift to lower-cost production methods, expenses tend to increase less than unit costs. This is a driving factor of state-level projected agricultural expenses for 2026 (and to a lesser extent for 2027) by RaFF.
National Trends
USDA-ERS (2026) and FAPRI-MU (2026) project U.S. NFI to decline in 2026 by 0.7% and 1.5%, respectively, compared to 2025, reaching $153.38 billion and $152.29 billion (see Table 1). Unlike the previous year, this expected downward trend is mainly driven by the first drop in cash receipts for animals and animal products, after two years of increases. In contrast, a slight rebound in crop receipts is projected, following three consecutive years of decline.
The 2026 crop receipts are projected to increase by 1%, totaling $240.82 billion, according to USDA-ERS, and by 2% to $243.53 billion, according to FAPRI-MU. As the leading crop produced in the United States, corn receipts are expected to grow by 3% in 2026, with higher beginning stocks. Corn prices are projected to rise slightly, amid anticipated lower domestic supply and weaker domestic and export demand (USDA-OCE, 2026). Soybean receipts remain stable relative to the previous year, while cash receipts for wheat are likely to decline. Domestic demand for soybeans would be partially supported by increased demand for soybean oil used in biofuels, driven by the 2025 modified rule to the Renewable Fuel Standard that increases volume obligations and reduces the credits for biofuels produced from imported feedstocks (USDA-OCE, 2026). Wheat production is expected to decline partly due to lower planted area. Cash receipts for major specialty crops, such as fruits, vegetables, and nuts are projected to trend upward overall, thanks to minorly improved prices, after a prolonged period of stagnant or declining prices.
The USDA-ERS (2026) projects total U.S. livestock receipts in 2026 to decrease by 6%, reaching $273.92 billion; however, they would remain 2% above the 2024 level. FAPRI-MU (2026) projects a smaller decline of 4%, to $279.93 billion. Cash receipts for cattle and calves, which account for the largest share of livestock receipts, continue to climb for the sixth consecutive year, up by 4%. This growth is driven by the contraction phase of the cattle cycle, as cattle and calves’ inventories have been declining for seven consecutive years. While there is an early sign of herd rebuilding from a small increase in heifer replacement head at the beginning of 2026 (USDA-NASS, 2026), the tight supply is likely to continue, along with high prices. Projected dairy receipts would decline, as larger herd size and increased productivity put downward pressure on milk prices (Ferrier, 2026). Egg receipts are expected to decrease as flock rebuilding accelerates following fewer and less impactful outbreaks of highly pathogenic avian influenza (HPAI), alleviating supply pressure (McConnell, 2026), and leading to lower prices.
Agricultural producers are projected to receive 37%–45% higher direct government payments in 2026, according to FAPRI-MU (2026) and USDA-ERS (2026), majorly supported by the changes in Agriculture Risk Coverage (ARC) and Price Loss Coverage (PLC) programs under the One Big Beautiful Bill Act (OBBBA) and ad hoc assistance programs.
The OBBBA authorizes changes in ARC/PLC program parameters to better reflect more recent market situations, resulting in higher likelihood of triggering payments. The program payments for crop year 2025—scheduled to begin in October 2026—are expected to be triggered for most covered commodities, including corn, soybeans, wheat, seed cotton, and rice. As a result, combined ARC/PLC payments in 2026 are projected to reach $14.92 billion—seven times the 2025 level—marking the largest payout in the programs’ history.
The Farmer Bridge Assistance (FBA) would provide up to $11 billion in one-time financial aid for farmers in 2026 for major crops also covered in ARC/PLC programs. These payments are intended to alleviate economic losses from weak commodity prices and trade-related market disruptions in 2025. Disbursements are expected by early 2026, serving as a temporary bridge until the benefits of the OBBBA, including expanded ARC/PLC payments, become available. As of May 3, 2026, $9.68 billion had been disbursed to over 500,000 approved applications. While the FBA focuses mainly on row crops, the Assistance for Specialty Crop Farmers program would offer up to $1 billion to sugar and specialty crops producers for similar purposes.
In addition, some payments from the Supplemental Disaster Relief Program (SDRP)—authorized by the American Relief Act of 2025 to offset the 2023–2024 weather-related crop losses—has yet to be distributed. As of the end of January 2026, only 37% of the $16.09 billion available had been disbursed (Munch and Parum, 2026).
State-Level Trends
At the state level, RaFF’s projections suggest a mixed trend among 10 states’ net farm incomes, even though the importance of direct government payments in supporting agricultural producers’ NFI is outsized across all states (see Figure 1). Table 2 shows that seven out of 10 states are projected to experience higher NFI in 2026 compared to the previous year, with increases ranging from 2% in Arkansas to 42% in North Dakota. Declines in NFI are forecast for Indiana (-28%), Iowa (-4%), and Missouri (-6%).
Projected crop receipts would show relatively small changes in most states, ranging from -5% in Arkansas to +7% in Minnesota. In contrast, greater variation is anticipated in livestock receipts, with the largest decline in Indiana (-21%) and the largest gain in North Dakota (+11%), reflecting the local mix of livestock production in each state and the widely different trends in prices across livestock products. While egg prices are projected to drop by 61% in Indiana in 2026, where cash receipts from eggs accounted for 35% of livestock receipts in 2025, cattle prices are projected to increase by 5% in North Dakota, where cattle and calves accounted for 86% of livestock receipts in 2025.
Amid ongoing uncertainty, production expenses are forecast to rise modestly by 1%–3% in nine out of ten states, while Missouri’s costs are expected to remain stable. This upward trend is partly driven by persistently high cattle prices that drive up purchased livestock costs, along with rising fuel and fertilizer prices linked to the conflict in the Strait of Hormuz.
Direct government payments would play a significant role in NFI again in 2026, especially in the states where both crop and livestock receipts are expected to decline, such as Arkansas, Illinois, and Missouri (see Figure 1). Across the 10 states, these payments in 2026 are projected to rise by 58% in Minnesota to 179% in Arkansas relative to the 2025 levels. They are expected to surpass the financial aid provided during the COVID-19 pandemic and reach new historical highs in all 10 states, ranging from $1.40 billion in Indiana to $5.01 billion in Texas.
The projected 2026 government payment would account for between 27% of NFI in Texas and 68% in North Dakota, highlighting spatial variation in the reliance on government support for agriculture (see Figure 2). Consistent with the national trend, these increases stem from two major sources: ARC/PLC and ad hoc program payments. Due to changes under the OBBBA, combined ARC and PLC payments are projected to substantially rise, ranging from a 56% increase in Minnesota to a 1,655% gain in Arkansas. Overall, the total payments from Farm Bill programs (e.g., ARC/PLC, conservation, and loan deficiency) would contribute to 7%–30% of NFI across the 10 states. Payments from ad hoc and supplementary programs are expected to be particularly vital for North Dakota’s and Minnesota’s farmers, where they account for over 40% of NFI. Meanwhile, these payments are projected to represent 19%–29% of NFI across the other eight states.
Uncertainties Ahead
The impact of the 2024/25 HPAI outbreak—which heavily affected the U.S. poultry flock and egg prices—eased and stabilized in the second half of 2025. However, the outbreak remains active in 2026. According to the USDA Animal and Plant Health Inspection Service (2026), as of April 24, 2026, there have been 104 confirmed cases affecting commercial flocks this year alone, resulting in the loss of over 17 million egg-laying hens. This figure represents 39% of the total number of commercial egg-laying hens affected in 2025. Across all commercial poultry operations, the number of 2026 cases are particularly high in Indiana (39 cases, 0.47 million birds affected) and Pennsylvania (18 cases, 8.56 million birds affected). The rising HPAI cases once again could put pressure on prices of poultry products, including broilers, eggs, and turkey.
The ongoing conflict with Iran could further exacerbate the vulnerability of American farmers by driving up fuel and fertilizer costs. Oil prices, measured per barrel of U.S. WTI crude oil, have risen by 54% between February and April 2026 (US EIA, 2026),[1] due to disruptions in production and transportation. The shipping constraints have also contributed to a surge in fertilizer prices: anhydrous ammonia prices during the second week of April were 29% higher than in February and urea prices were 41% higher (Quinn, 2026). In addition to the price effects, fertilizer import disruptions may impact the availability of fertilizers by planting time and therefore shift planting choices, for instance, from corn to soybeans in some areas (Hanrahan, 2026a). There are indications that the federal administration is seeking to facilitate importation of fertilizer from alternative sources, which may alleviate the potential risk of fertilizer shortage during this spring season (Hanrahan, 2026b).
The potential for extreme climate and weather conditions poses a risk in the 2026 agricultural production. Significant drought conditions are observed in the Southeast, South, and High Plains, with long-term impacts (greater than six months) projected in Nebraska, Arkansas, and northern Texas (Fuchs, 2026). States across the West are also expected to face low snowpack melts. In addition, the 2026 wildfires in Kansas, Nebraska, and Oklahoma have caused losses in grazing lands, adversely affecting the states’ livestock sector—particularly efforts to rebuild cattle herds (Polansek, 2026).
Amid several potential headwinds to U.S. agricultural profitability in 2026, additional financial aid for farmers has been under discussion. The Farm and Family Relief Act, first introduced in January 2026, proposes $17 billion in a one-time payment to producers across row crops, specialty crops, sugar beets, and forestry (House Agriculture Committee Democrats, 2026); however, the future of this legislation remains uncertain. In the meantime, the Farm, Food, and National Security Act of 2026 (the 2026 Farm Bill)—which was passed by the House of Representatives on April 30—aims to reauthorize and strengthen the farm safety net and conservation programs (Hart et al., 2026). Nonetheless, it may take considerable time before it is signed into law.
Concluding Comments
Net farm income in 2026 is likely to heavily rely on direct government payments again, specifically those from the farm safety net. A mixed trend is anticipated for both crop and livestock receipts across the ten states, while production expenditures are expected to rise, putting downward pressure on profit margins. Several uncertainties—including the Strait of Hormuz conflict, severe weather conditions, and HPAI outbreaks—should be closely monitored when looking into NFI this year.
[1] The increase in crude oil prices is calculated by comparing average WTI spot prices at Cushing, Oklahoma in April and February.
Tables & Figures
Table 1. U.S. Net Farm Income and its Components, 2025-2026 (billion dollars)
| USDA | FAPRI-MU | |||||
| 2025 | 2026 | %change 25-26 | 2025 | 2026 | %change 25-26 | |
| Crop Receipts | 238.05 | 240.82 | 1.2 | 238.05 | 243.53 | 2.3 |
| Livestock Receipts | 290.93 | 273.92 | -5.8 | 290.93 | 279.54 | -3.9 |
| Direct Govt Payments | 30.54 | 44.34 | 45.2 | 30.54 | 41.93 | 37.3 |
| Total Expenses | 473.12 | 477.68 | 1.0 | 473.12 | 476.59 | 0.7 |
| Net Farm Income | 154.54 | 153.38 | -0.6 | 154.54 | 152.29 | 1.5 |
Sources: USDA-ERS (2026); FAPRI-MU (2026).
Table 2. 2025–2026 Net Farm Income and its Components for 10 States (billion dollars)
| Arkansas | Illinois | |||||
| 2025 | 2026 | %change 25-26 | 2025 | 2026 | %change 25-26 | |
| Crop Receipts | 4.37 | 4.17 | -5 | 17.32 | 17.06 | -1 |
| Livestock Receipts | 8.06 | 7.64 | -5 | 4.47 | 4.23 | -5 |
| Direct Govt Payments | 0.63 | 1.75 | 179 | 1.68 | 2.97 | 76 |
| Total Expenses | 10.74 | 10.82 | 1 | 19.49 | 19.70 | 1 |
| Net Farm Income | 3.32 | 3.38 | 2 | 5.27 | 5.87 | 11 |
| Indiana | Iowa | |||||
| 2025 | 2026 | %change 25-26 | 2025 | 2026 | %change 25-26 | |
| Crop Receipts | 8.41 | 8.41 | 0 | 16.98 | 17.13 | 1 |
| Livestock Receipts | 6.97 | 5.53 | -21 | 22.90 | 21.87 | -4 |
| Direct Govt Payments | 0.81 | 1.40 | 73 | 2.54 | 4.10 | 62 |
| Total Expenses | 13.06 | 13.26 | 2 | 34.40 | 34.94 | 2 |
| Net Farm Income | 4.38 | 3.15 | -28 | 11.11 | 10.69 | -4 |
| Kansas | Minnesota | |||||
| 2025 | 2026 | %change 25-26 | 2025 | 2026 | %change 25-26 | |
| Crop Receipts | 8.38 | 8.46 | 1 | 11.63 | 12.47 | 7 |
| Livestock Receipts | 19.67 | 20.39 | 4 | 10.89 | 10.94 | 0 |
| Direct Govt Payments | 2.05 | 3.70 | 81 | 2.27 | 3.59 | 58 |
| Total Expenses | 23.55 | 24.25 | 3 | 21.69 | 21.97 | 1 |
| Net Farm Income | 8.81 | 9.66 | 10 | 6.10 | 6.38 | 5 |
| Missouri | Nebraska | |||||
| 2025 | 2026 | %change 25-26 | 2025 | 2026 | %change 25-26 | |
| Crop Receipts | 6.57 | 6.47 | -2 | 12.01 | 11.49 | 4 |
| Livestock Receipts | 8.33 | 7.38 | -11 | 23.55 | 22.85 | 3 |
| Direct Govt Payments | 1.00 | 1.84 | 83 | 2.97 | 1.74 | 71 |
| Total Expenses | 12.23 | 12.24 | 0 | 30.37 | 29.54 | 3 |
| Net Farm Income | 5.17 | 4.84 | -6 | 9.96 | 8.86 | 12 |
| North Dakota | Texas | |||||
| 2025 | 2026 | %change 25-26 | 2025 | 2026 | %change 25-26 | |
| Crop Receipts | 8.81 | 9.05 | 3 | 7.19 | 7.56 | 5 |
| Livestock Receipts | 1.97 | 2.18 | 11 | 26.84 | 26.47 | -1 |
| Direct Govt Payments | 1.46 | 3.05 | 109 | 2.41 | 5.01 | 108 |
| Total Expenses | 11.23 | 11.34 | 1 | 25.35 | 25.67 | 1 |
| Net Farm Income | 3.14 | 4.46 | 42 | 16.66 | 18.76 | 13 |
Source: https://raff.missouri.edu/farm-income/
Figure 1. Projected Annual Changes in 2026 Net Farm Income and Its Components
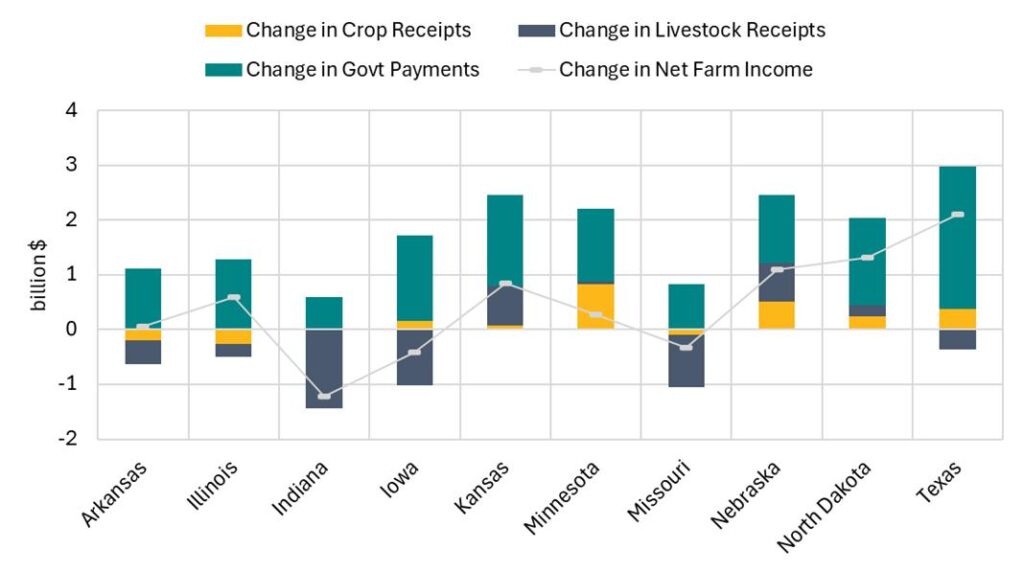
Figure 2. Government Payments as a Percentage of Net Farm Income, by Payment Type
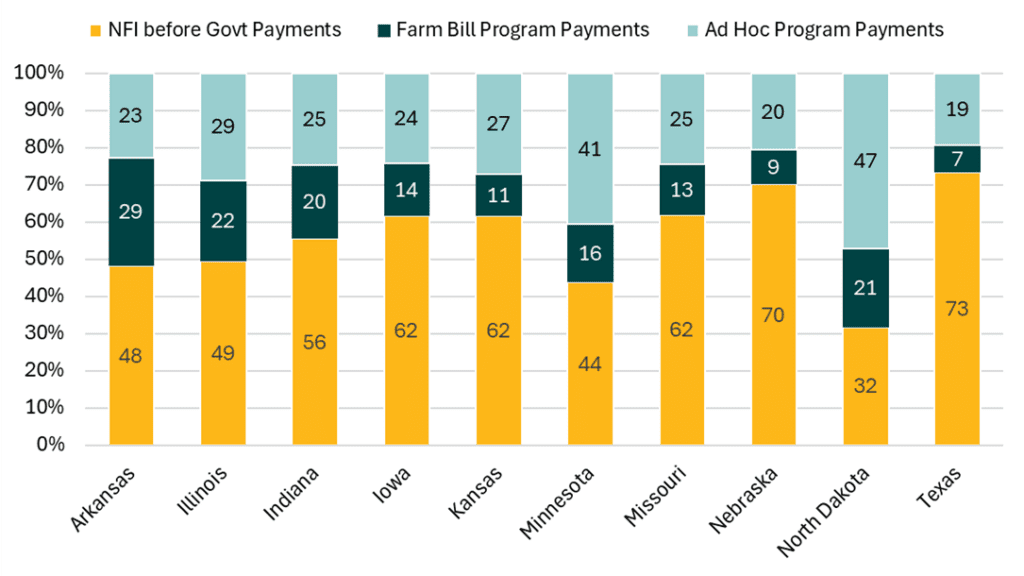
Note. The summation of percentages may not add up to 100% due to rounding.
References
- Munch, D., and F. Parum. 2026. “USDA Cuts 2025 Farm Income as Weakness Persists into 2026.” American Farm Bureau Federation. https://www.fb.org/market-intel/usda-cuts-2025-farm-income-as-weakness-persists-into-2026.
- FAPRI-MU. 2026. U.S. Agricultural Market Outlook. FAPRI-MU Report #01-26. March 26, 2026. https://fapri.missouri.edu/publications/2026-us-agricultural-market-outlook/.
- Ferrier, P. 2026. “Outlook for U.S. Dairy.” USDA’s 102nd Annual Agricultural Outlook Forum, February 19–20, 2026, Arlington VA. https://www.usda.gov/sites/default/files/documents/Dairy%20Outlook%20-REVISED.pdf.
- Fuchs, B. 2026. U.S. Drought Monitor. National Drought Mitigation Center, University of Nebraska-Lincoln. Released on April 23, 2026. https://droughtmonitor.unl.edu/.
- Hanrahan, R. 2026a. “Fertilizer Prices Have ‘Significant’ Rise After Attack on Iran.” Farm Policy News Summary. Farmdoc, University of Illinois, Department of Agricultural and Consumer Economics. March 4, 2026.
- Hanrahan, R. 2026b. “US Seeking Fertilizer from Venezuela, Morocco Amid Iran War.” Farm Policy News Summary. Farmdoc, University of Illinois, Department of Agricultural and Consumer Economics. March 18, 2026.
- Hart, O., Z. Lee, E. Covoner, R. Yeung, and A. Nober. 2026. House Agriculture Committee Advances 2026 Farm Bill.” National Association of Counties. March 5, 2026. https://www.naco.org/news/house-agriculture-committee-advances-2026-farm-bill.
- House Agriculture Committee Democrats. 2026. “Farm and Family Relief Act Summary.” https://democrats-agriculture.house.gov/uploadedfiles/260122_-_one-pager_-_farm_and_family_relief_act_summary.pdf.
- McConnell, M. “Outlook for Livestock and Poultry in 2026.” USDA’s 102nd Annual Agricultural Outlook Forum, February 19–20, 2026, Arlington VA. https://www.usda.gov/sites/default/files/documents/2026AOF-livestock-poultry-outlook-Rev.pdf
- Polansek, T. 2026. “Nebraska Fires Burn Grazing Lands, Threaten Plans to Grow US Cattle Herd.” Insurance Journal. March 23, 2026. https://www.insurancejournal.com/news/midwest/2026/03/23/863071.htm.
- Quinn, R. 2026. “6 Retail Fertilizer Prices See Sizable Moves Higher.” DTN Retail Fertilizer Trends, Progressive Farmer. April 22, 2026. https://www.dtnpf.com/agriculture/web/ag/crops/article/2026/04/22/6-fertilizer-prices-see-sizeable.
- US EIA. 2026. Petroleum & Other Liquids Spot Prices. https://www.eia.gov/dnav/pet/pet_pri_spt_s1_d.htm. Last accessed on May 5, 2026.
- USDA Animal and Plant Health Inspection Service. 2026. Confirmations of Highly Pathogenic Avian Influenza in Commercial and Backyard Flocks. https://www.aphis.usda.gov/livestock-poultry-disease/avian/avian-influenza/hpai-detections/commercial-backyard-flocks. Last accessed on April 24, 2026.
- USDA-ERS. 2026. Farm Income and Wealth Statistics – Data Files: U.S. and State-Level Farm Income and Wealth Statistics. https://www.ers.usda.gov/data-products/farm-income-and-wealth-statistics/data-files-us-and-state-level-farm-income-and-wealth-statistics. Released on February 5, 2026.
- USDA-NASS. 2026. Cattle Inventory. https://www.nass.usda.gov/Surveys/Guide_to_NASS_Surveys/Cattle_Inventory/ Released on January 30, 2026.
- USDA-OCE. 2026. “Grains and Oilseeds Outlook.” Oilseeds, Feed Grains, Wheat, and Rice Interagency Commodity Estimates Committees. USDA’s 102nd Annual Agricultural Outlook Forum, February 19–20, 2026, Arlington VA. https://www.usda.gov/about-usda/general-information/staff-offices/office-chief-economist/agricultural-outlook-forum/aof-commodity-outlooks
Contact Information
Oranuch Wongpiyabovorn, Senior Research Associate: owongpiyabovorn@missouri.edu
Alejandro Plastina, Director: aplastina@missouri.edu
Acknowledgements
The development of this Policy Brief was supported by the US Department of Agriculture, Office of the Chief Economist, Award ID 58-0111-23-017. The findings and conclusions in this report are those of the authors and should not be construed to represent any official USDA or US Government determination or policy.
Signup For Our Email Announcements
