
Extra ARC-CO and PLC Payments from the One Big Beautiful Bill Act
RaFF Policy Brief 2026-9(2)
By: Tayatorn Pongspikul, Oranuch Wongpiyabovorn, Alejandro Plastina, Anup Paudel, Chandan Bhattarai, and Jennifer Ifft
September 1, 2026
This policy brief presents projected ARC-CO and PLC payments for corn, soybeans, and wheat base acres for the 2025 and 2026 crop years. For 2026, projected payments are evaluated under three enrollment scenarios to illustrate how different ARC-CO and PLC enrollment assumptions would affect payment outcomes.
Download Printable Policy Brief (PDF)Background
The One Big Beautiful Bill Act (OBBBA) revises the Agricultural Risk Coverage at the county level (ARC-CO) and Price Loss Coverage (PLC) programs by updating key program parameters beginning with the 2025 crop year and expanding commodity program base acres beginning with the 2026 crop year. Table 1 summarizes the changes in ARC-CO and PLC policy parameters for corn, soybeans, and wheat relative to the 2018 Farm Bill (FB18). Payments are projected to be higher under the new legislation. Combined payments across the three crops would increase by $4.66 billion for the 2025 crop year, while projected additional payments for the 2026 crop year range from $1.30 billion to $2.13 billion, depending on producer enrollment decisions.
Although OBBBA is projected to increase payments in both crop years, the factors driving those increases differ. For the 2025 crop year, the temporary provision allowing producers to receive the higher of ARC-CO or PLC payments regardless of enrollment accounts for a large share of the projected payment increase. Beginning in 2026, however, projected payment outcomes vary with producer enrollment because producers once again would receive payments based on their program election, and commodity program base acres are expanded. To reflect different enrollment assumptions, projected 2026 payments are evaluated under three enrollment scenarios.
Data and Projection Scenarios
The payment projections presented in this policy brief compare expected ARC-CO and PLC payments under OBBBA with those under FB18, using formulas from FB18 and the new policy parameters under OBBBA. The analysis uses projected marketing year average (MYA) prices from the May 2026 WASDE report (USDA-OCE 2026). The projected MYA prices for the 2025 crop year are $4.15 per bushel for corn, $10.40 per bushel for soybeans, and $5.00 per bushel for wheat. For the 2026 crop year, the projected MYA prices are $4.40 per bushel for corn, $11.40 per bushel for soybeans, and $6.50 per bushel for wheat. Additional information on the data sources, assumptions, and projection methods is available in Wongpiyabovorn et al. (2026).
The projection approach differs between the 2025 and 2026 crop years because OBBBA includes a temporary provision that applies only to the 2025 crop year. Under this provision, producers receive the higher of the ARC-CO or PLC payment regardless of the program in which their base acres were enrolled.
For the 2026 crop year, projected payments depend on producer enrollment in ARC-CO and PLC. Three enrollment scenarios are evaluated to reflect different enrollment assumptions. Scenario 1 assumes producers maintain historical county-level enrollment patterns observed during 2019–2024. Scenario 2 applies national average participation rates obtained from the Food and Agricultural Policy Research Institute (FAPRI 2025, 2026) to all counties. Scenario 3 projects county-level enrollment using a forward-looking model. The national average projected PLC participation rates for the three 2026 enrollment scenarios are presented in Table 2.
Projected Payments for the 2025 Crop Year
OBBBA is projected to increase ARC-CO and PLC payments for the 2025 crop year relative to FB18. Under OBBBA, total projected payments are $3.06 billion for corn, $540.22 million for soybeans, and $2.77 billion for wheat (Table 3). Across the three commodities, total projected payments under OBBBA are $6.37 billion, compared with $1.71 billion under FB18. This represents an additional $4.66 billion in projected payments. Corn accounts for the largest projected payment increase, followed by wheat and soybeans. Regional payment distributions generally reflect the concentration of enrolled base acres, with the Heartland (with a core around the I-states) accounting for the largest share of projected payments for corn and soybeans, and the Prairie Gateway (spanning from southern Nebraska to central Texas) accounting for the largest share of payments for wheat.
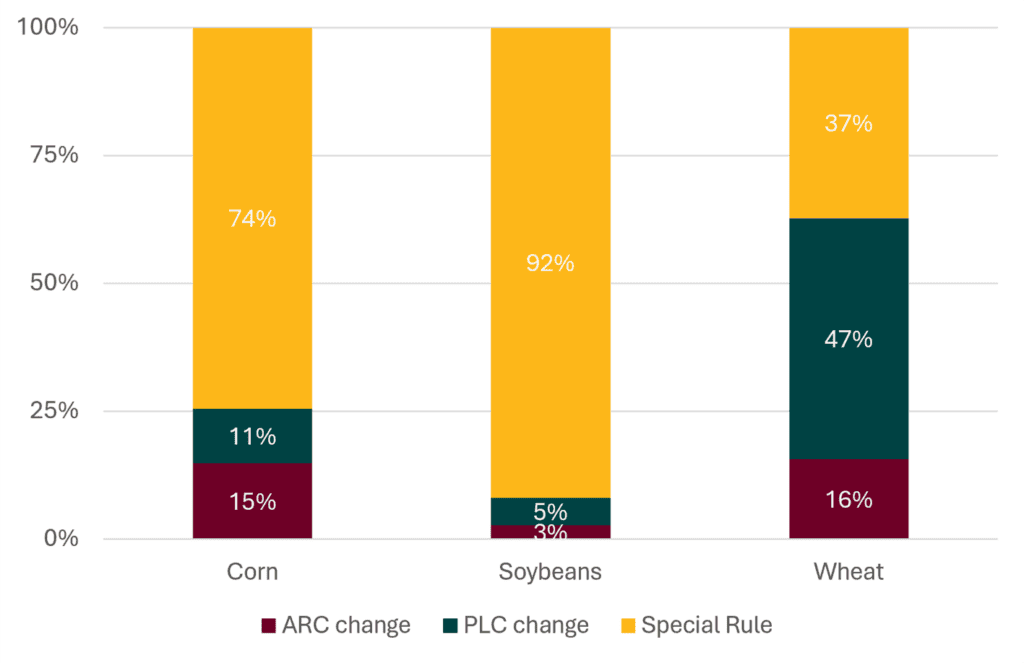
A large share of the projected increase in 2025 payments results from the temporary OBBBA provision allowing producers to receive the higher of ARC-CO or PLC payments regardless of their program election. This provision accounts for approximately 74% of the additional projected payments for corn, 92% for soybeans, and 37% for wheat (Figure 1). The remaining projected increases reflect higher PLC payment rates and revised ARC-CO payment parameters under OBBBA.
Projected Payments for the 2026 Crop Year
Unlike the 2025 crop year, projected ARC-CO and PLC payments for 2026 depend on producer enrollment in the programs. Under OBBBA, total projected payments for corn range from $1.42 billion in Scenario 2 to $1.49 billion in Scenario 1 and $2.41 billion in Scenario 3 (Table 4). Scenario 3 is projected to produce higher payments than the other two scenarios, reflecting its lower projected PLC participation rate. The Heartland region accounts for the largest share of projected corn payments across all three scenarios, receiving 59%–61% of the national total. The region also accounts for a large share of the projected expansion in corn base acres.
Total projected payments for soybeans under OBBBA range from $96.33 million in Scenario 2 to $109.57 million in Scenario 1 and $119.06 million in Scenario 3 (Table 4). The projected 2026 MYA price of $11.40 per bushel exceeds the effective reference price of $10.71 per bushel, so no PLC payments are projected. Consequently, a lower PLC participation rate results in more base acres enrolled in ARC-CO and higher projected total payments. At the regional level, the Heartland region receives the largest projected soybean payments across all three scenarios, accounting for 38%–40% of the national total.
A similar pattern is observed for wheat. Total projected payments under OBBBA range from $80.74 million in Scenario 2 to $114.62 million in Scenario 1 and $206.41 million in Scenario 3 (Table 4). The projected MYA price of $6.50 per bushel exceeds the effective reference price of $6.35 per bushel, so no PLC payments would be triggered. Scenario 3, which has a lower PLC participation rate, therefore produces the highest projected wheat payments. The Prairie Gateway region accounts for approximately half of projected national wheat payments across all three scenarios.
As shown in Figure 2, the sources of additional payments under OBBBA differ across commodities and enrollment scenarios. Changes in ARC-CO parameters account for much of the increase in projected payments, while expanded base acres also contribute to the additional payments. Changes in PLC parameters have a smaller effect in 2026 because the projected MYA prices for soybeans and wheat exceed their effective reference prices.
Combined payments for corn, soybeans, and wheat under OBBBA are projected to range from $1.60 billion in Scenario 2 to $1.71 billion in Scenario 1 and $2.73 billion in Scenario 3 (Table 4). Compared with projected payments under FB18, OBBBA results in additional payments ranging from $1.30 billion in Scenario 2 to $2.13 billion in Scenario 3, an increase of 351%–430%. The differences across scenarios highlight the role of producer enrollment in determining projected program payments.
Concluding Comments
The OBBBA changes to ARC-CO and PLC are projected to increase commodity program payments for corn, soybeans, and wheat relative to FB18 in both the 2025 and 2026 crop years. For 2025, additional projected payments total $4.66 billion, including $2.72 billion for corn, $0.53 billion for soybeans, and $1.41 billion for wheat. The temporary provision allowing producers to receive the higher of the ARC-CO or PLC payment regardless of their program election is a major source of the projected increase in 2025 payments.
For 2026, additional projected payments relative to FB18 vary across the three enrollment scenarios, ranging from $1.16 billion to $1.86 billion for corn, $81.99 million to $103.37 million for soybeans, and $52.69 million to $164.13 million for wheat. Across the three commodities, the variation in projected payments across enrollment scenarios demonstrates how different ARC-CO and PLC enrollment rates can affect payment outcomes.
Projected 2026 payments are generally highest under the scenario with forward-looking county-level enrollment rates and lowest under the scenario based on national average enrollment rates. This difference reflects lower projected PLC participation under the forward-looking scenario, particularly because PLC payments would not be triggered for soybeans or wheat under the price assumptions used in the analysis. Together with the temporary “higher-of” provision in 2025, these results illustrate how program provisions and producer enrollment decisions can influence the magnitude of ARC-CO and PLC payments.
The payment projections presented in this analysis are based on MYA prices from the May 2026 WASDE report. The August 2026 WASDE projections for the 2025 crop year remain unchanged from those used in the analysis. For the 2026 crop year, however, the projected MYA price for corn increased from $4.40 to $4.50 per bushel, the projected soybean price remained unchanged at $11.40 per bushel, and the projected wheat price decreased from $6.50 to $6.20 per bushel. Holding all other factors constant, the higher projected corn price would result in lower ARC-CO and PLC payments than those presented in this analysis, while the lower projected wheat price would result in higher payments. Because the projected soybean price is unchanged, there would be no change in projected soybean payments due to the updated price projection alone.
Contact Information
Tayatorn Pongspikul, Post-doctoral Fellow, RaFF: tkpongspikul@missouri.edu
Acknowledgements
The development of this report was supported by the U.S. Department of Agriculture, Office of the Chief Economist, Award ID 58-0111-23-017. The findings and conclusions in this report are those of the authors and should not be construed to represent any official USDA or U.S. Government determination or policy.
Tables & Figures
Table 1. Comparison of ARC-CO and PLC policy parameters for corn, soybeans, and wheat between FB18 and OBBBA
| Policy Parameter | 2018 Farm Bill (FB18) | One Big Beautiful Bill (OBBBA) | |
| Crop Year 2025 | Crop Year 2025 | Crop Year 2026 and beyond | |
| 1. Statutory Reference Price | Corn: $3.70/bushel Soybeans: $8.40/bushel Wheat: $5.50/bushel | Corn: $4.10/bushel Soybeans: $10.00/bushel Wheat: $6.35/bushel | Corn: $4.10/bushel Soybeans: $10.00/bushel Wheat: $6.35/bushel Starting in 2031, reference prices will increase by 0.5% each year |
| 2. Effective Reference Price (ERP) | The minimum of (1) 115% of Statutory Reference Price (2) The maximum of 85% of average of 5-year historical MYA prices, excluding the highest and lowest values; and Statutory Reference Price Corn 2025 ERP: $4.26/bushel Soybeans 2025 ERP: $9.66/bushel Wheat 2025 ERP: $5.56/bushel | The minimum of (1) 115% of Statutory Reference Price (2) The maximum of 88% of average of 5-year historical MYA prices, excluding the highest and lowest values; and Statutory Reference Price Corn 2025 and 2026 ERP: $4.42/bushel Soybeans 2025 and 2026 ERP: $10.71/bushel Wheat 2025 and 2026 ERP: $6.35/bushel | |
| 3. ARC-CO Revenue Guarantee | 86% of benchmark revenue | 90% of benchmark revenue | |
| 4. ARC-CO Maximum Payment Rate | 10% of benchmark revenue | 12% of benchmark revenue | |
| 5. Loan Rate | Corn: $2.20/bushel Soybeans: $6.20/bushel Wheat: $3.38/bushel | Unchanged | Corn: $2.42/bushel Soybeans: $6.82/bushel Wheat: $3.72/bushel |
| 6. Program Payments | Program-specific, based on enrolled acres | Highest dollar value of PLC or ARC-CO payments by enrolled base acre, irrespective of program choice | Program-specific, based on enrolled acres |
| 7. Base Acres^ | As determined in FB18 for crop year 2024. Total U.S. enrolled base acres (USDA-FSA, 2026): Corn: 91,933,644 acres Soybean: 52,250,210 acres Wheat: 61,051,592 acres | Unchanged | As determined in FB18 for crop year 2024 + new base acres. Wongpiyabovorn and Plastina (2026)’s projection of total U.S. base acres: Corn: 111,860,563 acres Soybean: 65,453,563 acres Wheat: 75,794,825 acres |
^The total base acres for crop year 2025 are actual enrolled base acres in ARC-CO and PLC reported by USDA FSA (2026), which could be lower than total base acres largely due to unenrolled base acres and ARC-IC enrolled base acres. In contrast, enrolled base acres for crop year 2026 assume full participation in ARC-CO and PLC, and no participation in ARC-IC. Source: Wongpiyabovorn et al. (2026).
Table 2. National average projected PLC participation rates used for the 2026 enrollment scenarios.
| Scenario | Corn | Soybeans | Wheat | |||
| FB18 | OBBBA | FB18 | OBBBA | FB18 | OBBBA | |
| Scenario 1: Historical county average | 51% | 51% | 13% | 14% | 69% | 70% |
| Scenario 2: National average | 59% | 53% | 23% | 25% | 69% | 79% |
| Scenario 3: Forward-looking county rates | 14% | 15% | 5% | 5% | 41% | 42% |
Source: Wongpiyabovorn et al. (2026)
Table 3. National projected ARC-CO and PLC payments for the 2025 crop year under the FB18 and OBBBA
| Commodity | Total payments for ARC-CO + PLC (million$) | ||
| FB18 | OBBBA | Extra | |
| Corn | 342.20 | 3,057.37 | 2,715.17 |
| Soybeans | 8.66 | 540.22 | 531.56 |
| Wheat | 1,360.28 | 2,767.61 | 1,407.33 |
| Total | 1,711.14 | 6,365.20 | 4,654.06 |
Source: Wongpiyabovorn et al. (2026)
Table 4. National projected ARC-CO and PLC payments for the 2026 crop year under the FB18 and OBBBA, by enrollment scenario
| Commodity | Total payments for ARC-CO + PLC (million$) | ||||||||
| Scenario 1 | Scenario 2 | Scenario 3 | |||||||
| FB18 | OBBBA | Extra | FB18 | OBBBA | Extra | FB18 | OBBBA | Extra | |
| Corn | 324.05 | 1,487.45 | 1,163.40 | 259.89 | 1,424.15 | 1,164.26 | 548.27 | 2,407.38 | 1,859.11 |
| Soybeans | 14.69 | 109.57 | 94.88 | 14.34 | 96.33 | 81.99 | 15.68 | 119.06 | 103.37 |
| Wheat | 24.21 | 114.62 | 90.41 | 28.06 | 80.74 | 52.69 | 42.28 | 206.41 | 164.13 |
| Total | 362.95 | 1,711.64 | 1,348.69 | 302.28 | 1,601.22 | 1,298.95 | 606.24 | 2,732.85 | 2,126.61 |
Source: Wongpiyabovorn et al. (2026)
Figure 1. Sources of increases in ARC-CO and PLC payments for crop year 2025
Source: Wongpiyabovorn et al. (2026)
Figure 2. Sources of increases in ARC-CO and PLC payments for crop year 2026
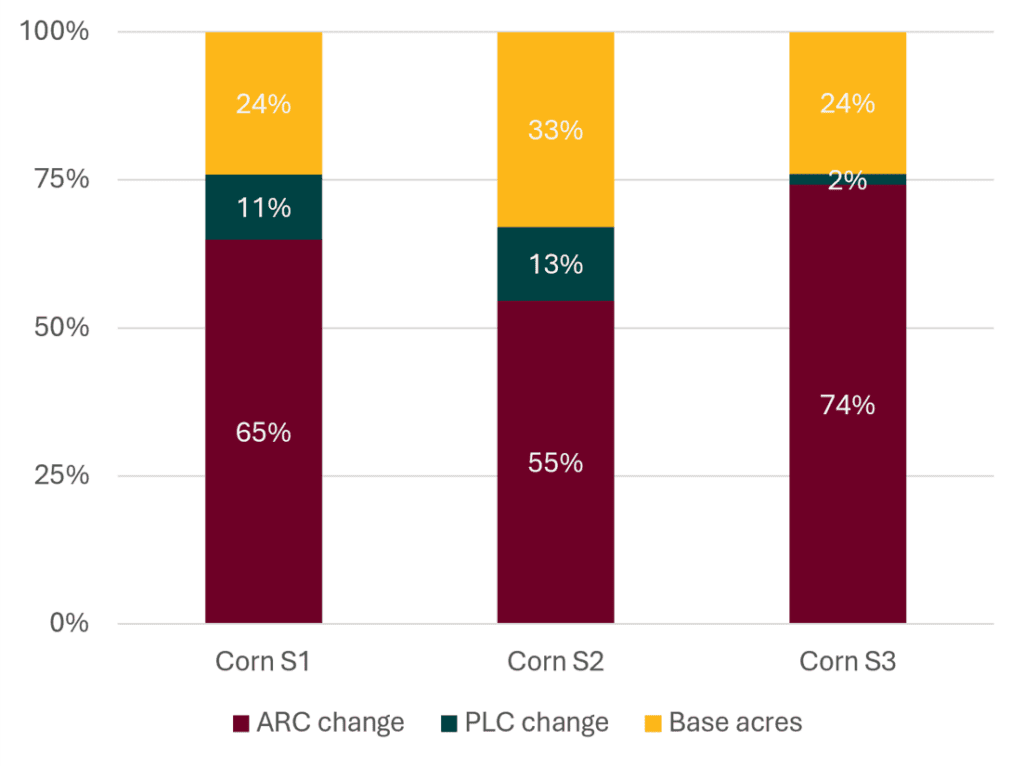
(a) Corn
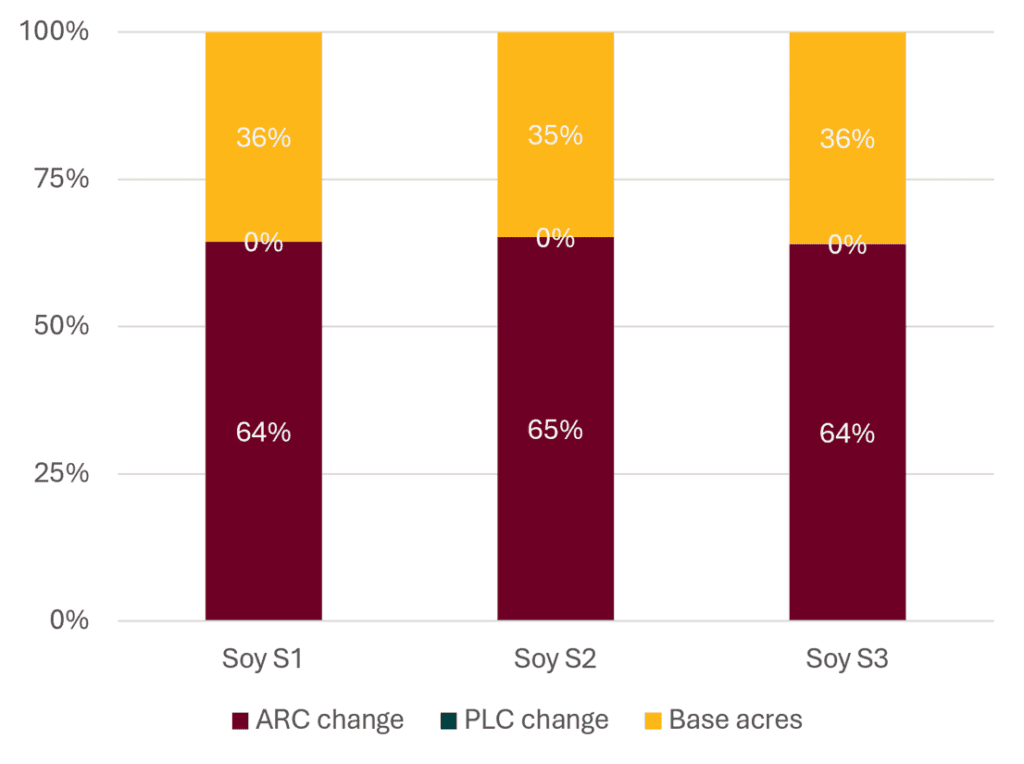
(b) Soybeans
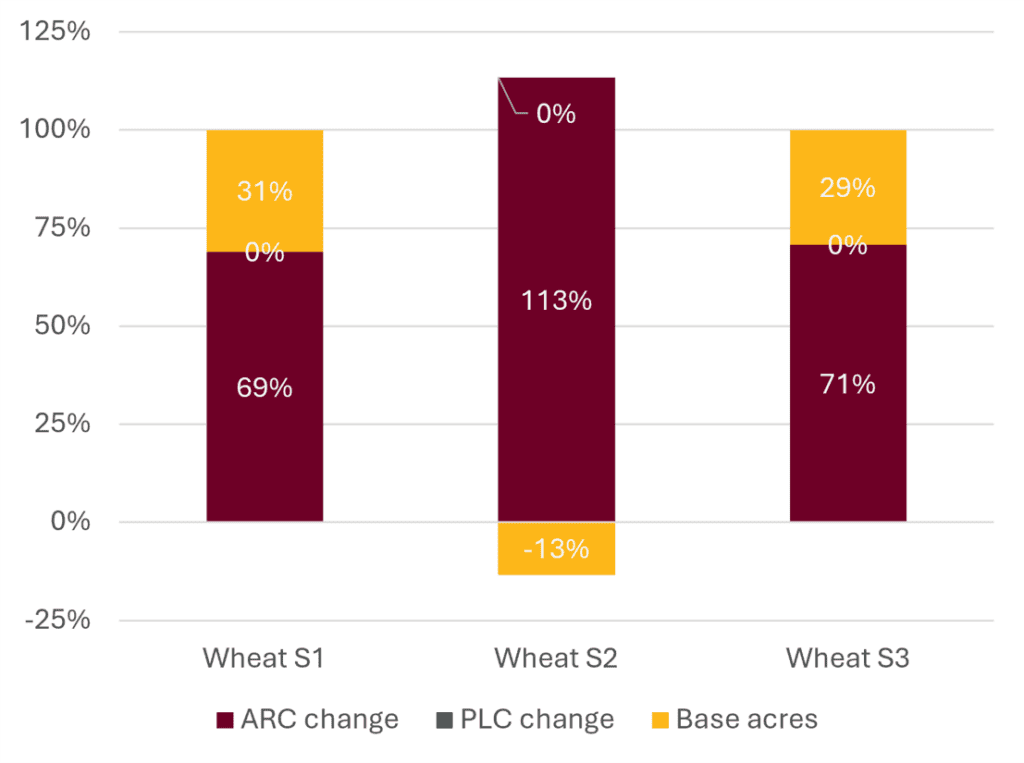
(c) Wheat
Note: The negative contribution of base acre expansion in projected payments for wheat in Scenario 2 stems from the combined effect of a higher proportion of PLC enrollment and no PLC payments. As the PLC participation rate in Scenario 2 increases from 69% under FB18 to 79% under OBBBA, the share of base acres enrolled in ARC-CO could decline even after accounting for base acre expansion. Source: Wongpiyabovorn et al. (2026)
References
Food & Agricultural Policy Research Institute. 2025. “Impacts of Selected Agricultural Provisions of the “One Big Beautiful Bill Act”.” Report #02-25. University of Missouri – Columbia. https://fapri.missouri.edu/wp-content/uploads/2025/09/FAPRI-MU-Report-02-25.pdf.
———. 2026. “U.S. Agricultural Market Outlook.” Report #01-26. University of Missouri – Columbia. https://fapri.missouri.edu/publications/2026-us-agricultural-market-outlook/.
United States Department of Agriculture, Farm Service Agency (USDA-FSA). 2026. “ARC and PLC Data.” https://www.fsa.usda.gov/resources/programs/arc-plc/program-data. Accessed on May 18, 2026.
United States Department of Agriculture, Office of Chief Economist (USDA-OCE). 2026. “WASDE Report.” https://www.usda.gov/about-usda/general-information/staff-offices/office-chief-economist/commodity-markets/wasde-report. Accessed on May 18, 2026.
Wongpiyabovorn, O., and A. Plastina. 2026. “Additional Base Acres for ARC and PLC: January 2026 Update.” RaFF Policy Brief 2025-1(2). Rural and Farm Finance Policy Analysis Center, University of Missouri – Columbia. https://eadn-wc02-7100781.nxedge.io/wp-content/uploads/2026/01/2026-1-2-Policy-Brief.pdf.
Wongpiyabovorn, O., T. Pongspikul, A. Plastina, A. Paudel, C. Bhattarai, and J. Ifft. 2026. “Expanded Farm Safety Net Payments Under the One Big Beautiful Bill Act.” Applied Economic Perspective and Policy 1–12. https://doi.org/10.1002/aepp.70120.
Pongspikul, T., Wongpiyabovorn, O., Plastina, A., Paudel, A., Bhattarai, C., and Ifft, J. “Extra ARC-CO and PLC Payments from the One Big Beautiful Bill Act.” RaFF Policy Brief 2026-9(2), Rural and Farm Finance Policy Analysis Center, University of Missouri, Columbia. Sep. 1, 2026. Available at raff.missouri.edu.
Signup For Our Email Announcements
