
Insights on Nontraditional Farm Finance
A comprehensive view of farm finance should reflect loan activity across lender types. However, evidence suggests official reports underestimate agricultural debt extended by nontraditional lenders including vendors, private banks, credit unions and family and friends. RaFF supports research into nontraditional farm finance to provide a fuller picture of farm financial conditions to policymakers and other decision-makers. The work presented below summarizes nontraditional farm finance insights.
Weaving the Web of Nontraditional Ag Finance
November 24, 2025
By: Jennifer Ifft, Joe Parcell, Alice Roach, Anup Paudel, Mackenzie Malson
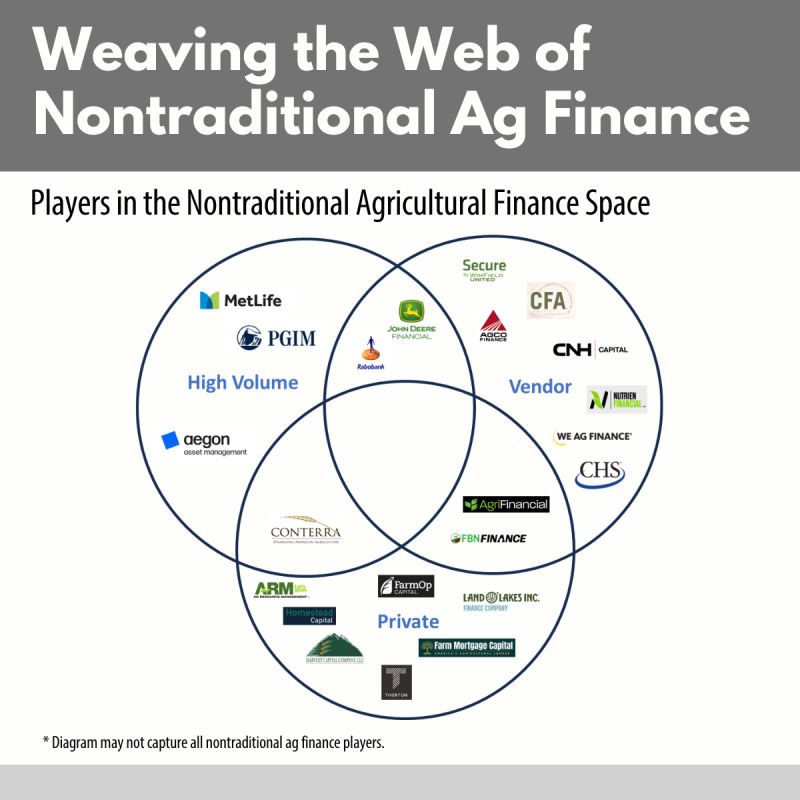
A complex web aptly summarizes the evolution of nontraditional finance in agriculture.
You can think of nontraditional finance in one of the following ways:
- Loans originating from entities outside a traditional local lender branch model (the model typically used by banks and Farm Credit institutions)
- Loans originating from entities whose primary relationship with producers is something other than lending
Assuming the first definition, the graphic shows a present-day web of nontraditional ag finance players. It doesn’t include all types of nontraditional lenders. For example, you won’t find credit card companies or specific individuals listed. Further, “nontraditional” isn’t being used to reflect a particular lender’s length of time providing agricultural finance: MetLife is likely the oldest agricultural mortgage provider operating today. However, it’s a start to survey the landscape, which generally has three types of lenders.
- Vendors and their finance partners extend credit for equipment, inputs and other products purchased at retail. The types of entities in this category include manufacturers and co-ops. We classify two of the vendor finance players as high-volume — John Deere Financial and Rabobank — because of their scale and frequency in partnering with other vendors to finance customer purchases.
- Other high-volume lenders work on an institutional scale. They compete for large, creditworthy accounts and centralize their underwriting or rely on correspondent networks instead of stand up local branches. Insurance companies and asset managers fit in this group, which often finances ag real estate.
- Private lenders differ from banks because they don’t accept deposits. They often choose a particular market segment to target (e.g., high-risk borrowers) and stress the convenience customers receive when working with them.
An Understatement on U.S. Farm Debt
November 25, 2025
By: Jennifer Ifft, Joe Parcell, Alice Roach
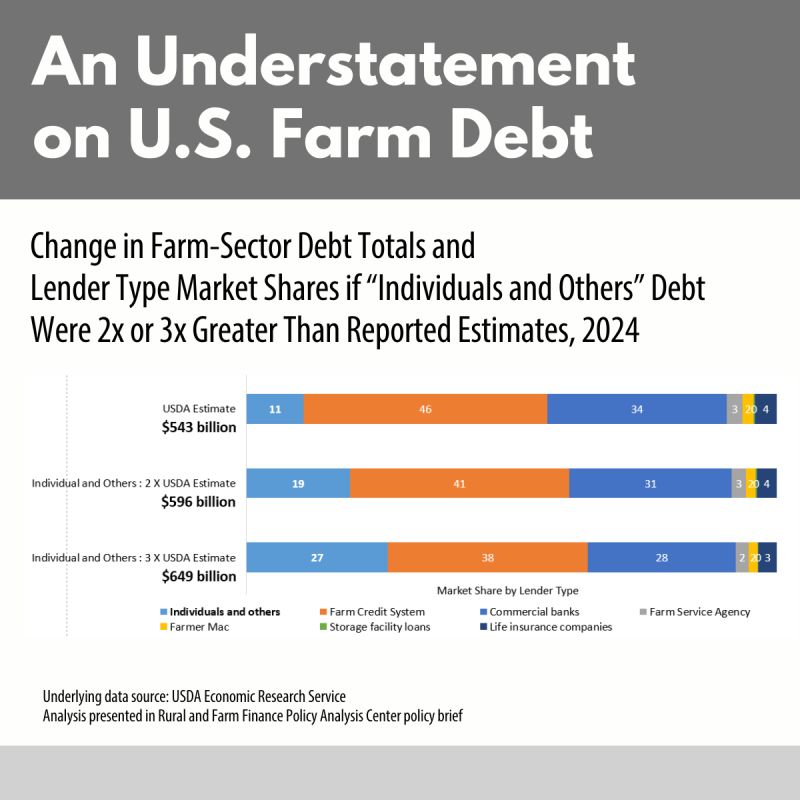
A RaFF policy brief published last year concluded that farm debt held by “individuals and others” — a catchall for input suppliers, implement dealers, credit card companies, credit unions, private banks, family and friends — is likely two to three times greater than reported in official estimates. USDA Economic Research Service leadership noted the challenge associated with fully capturing nontraditional finance activity and supported a special issue of the Agricultural Finance Review in 2022 to better understand nontraditional finance.
The graphic shows the effect of two to three times more individuals and others debt than reported. If individuals and others debt were double the reported value, then total farm debt would be an estimated $50 billion more than reported, and individuals and others would hold almost 20% of all farm debt.
Accurately representing “individuals and others” debt volumes has its challenges because public reporting of debt held by these lenders isn’t as robust as reporting of debt held by commercial banks, Farm Credit associations or the USDA Farm Service Agency. You can think about the term ‘less regulated’ to emphasize this point.
The “less regulated” farm finance landscape has grown, and as some farms face more financial uncertainty, this space is one to keep observing. Will farms feel more drawn to “less regulated” financing if they need to bridge a gap in capital available from other lenders? Will lenders categorized as “individuals and others” increase their presence to capture more market share?
Straight From the Source: Company-reported Data can Show Trends in Farm-related Vendor Finance Activity
November 26, 2025
By: Jennifer Ifft, Joe Parcell, Alice Roach, Anup Paudel, Mackenzie Malson
A contributing factor to the potential for U.S. farm debt to be underestimated is that official estimates do not completely reflect debt held by all lenders—in particular, those with no obligation to report ag loan holdings to a regulator that then aggregates data for all reporting lenders. Examples include private banks, ag finance companies and vendors.
The opaqueness begs a question. What data sources could help with developing a fuller picture of farm debt?
Annual and quarterly financial data that publicly traded firms release — often to the U.S. Securities and Exchange Commission — represent a possible source. The data can be difficult to merge across lenders to arrive at totals, and in some cases, financial data aren’t available exclusively for agriculture in the U.S. However, the filings do add value by usually indicating the amount of debt a lender carries and the debt’s credit quality.
Click on the figures below to see data from several vendors that offer financing to retail customers for farm equipment and other inputs, such as seed and crop protection. (Note, some also extend debt to wholesale customers.) The data help to understand vendor finance debt volumes and evaluate borrower repayment status.
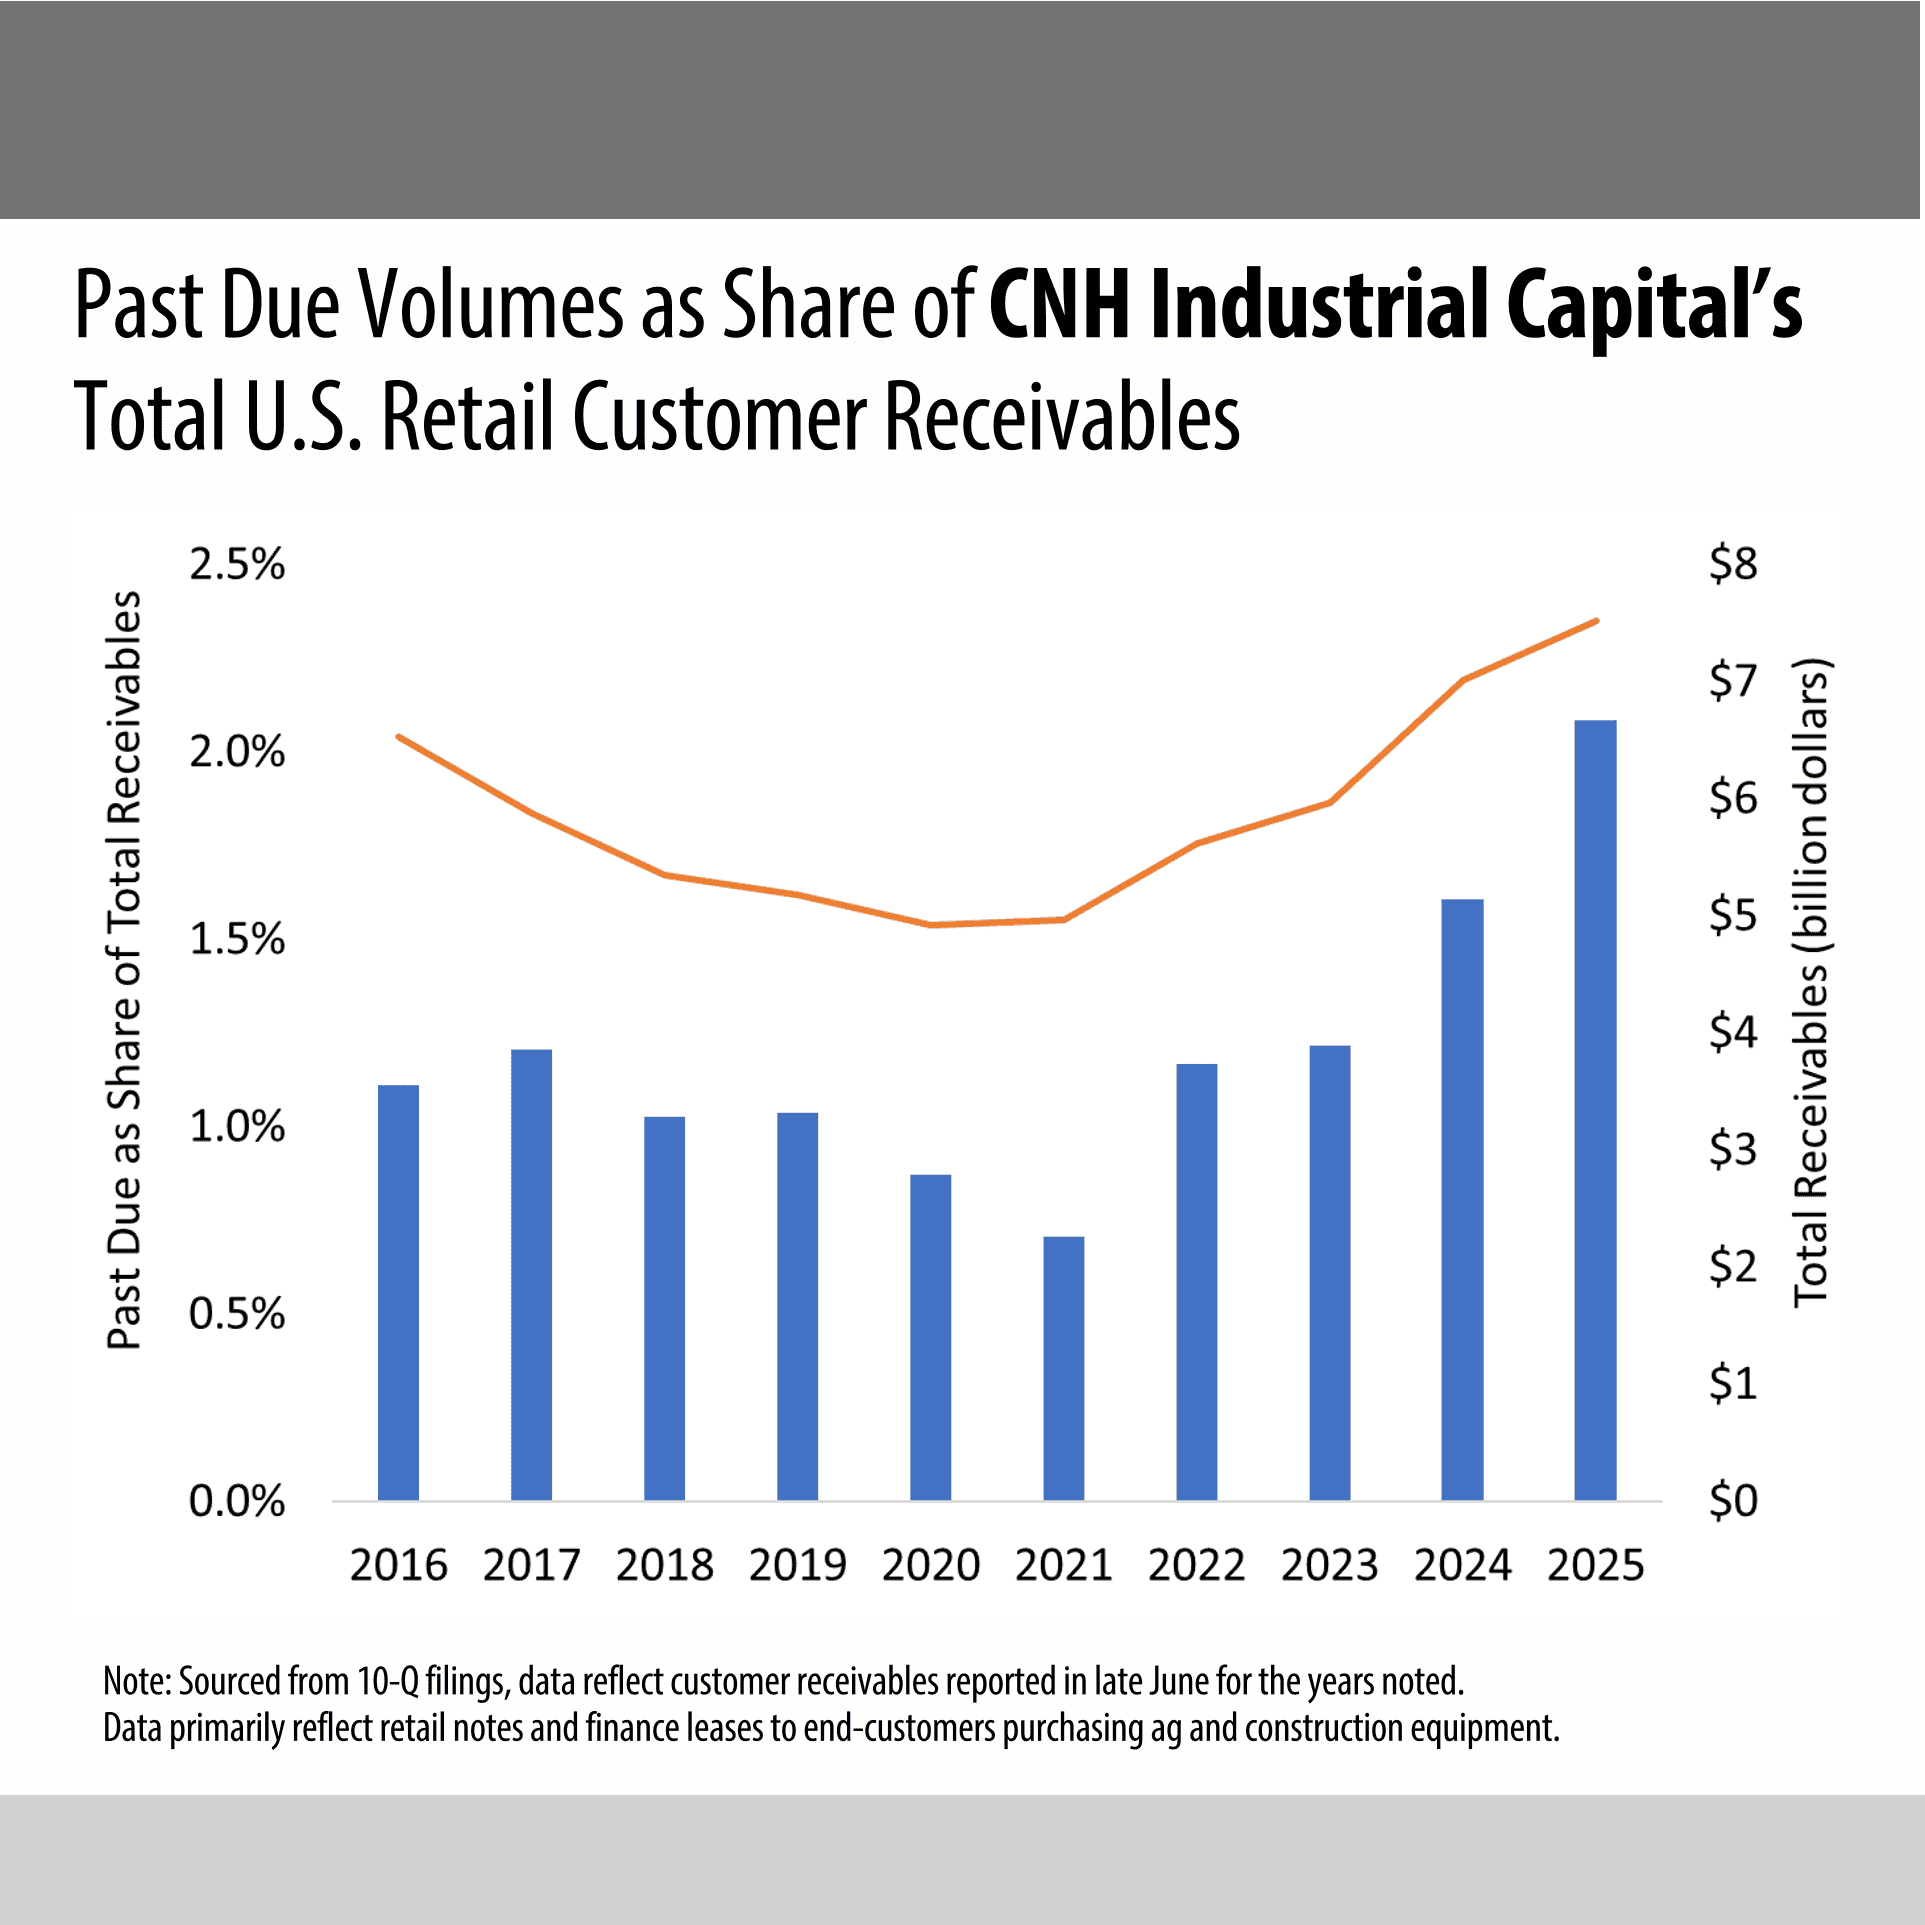
CNH Industrial Capital finances ag and construction equipment. The chart shows the combined receivables volume increased from mid-2024 to $7.5 billion in mid-2025. The share of debt considered past due also rose from 1.6% to 2.1%.
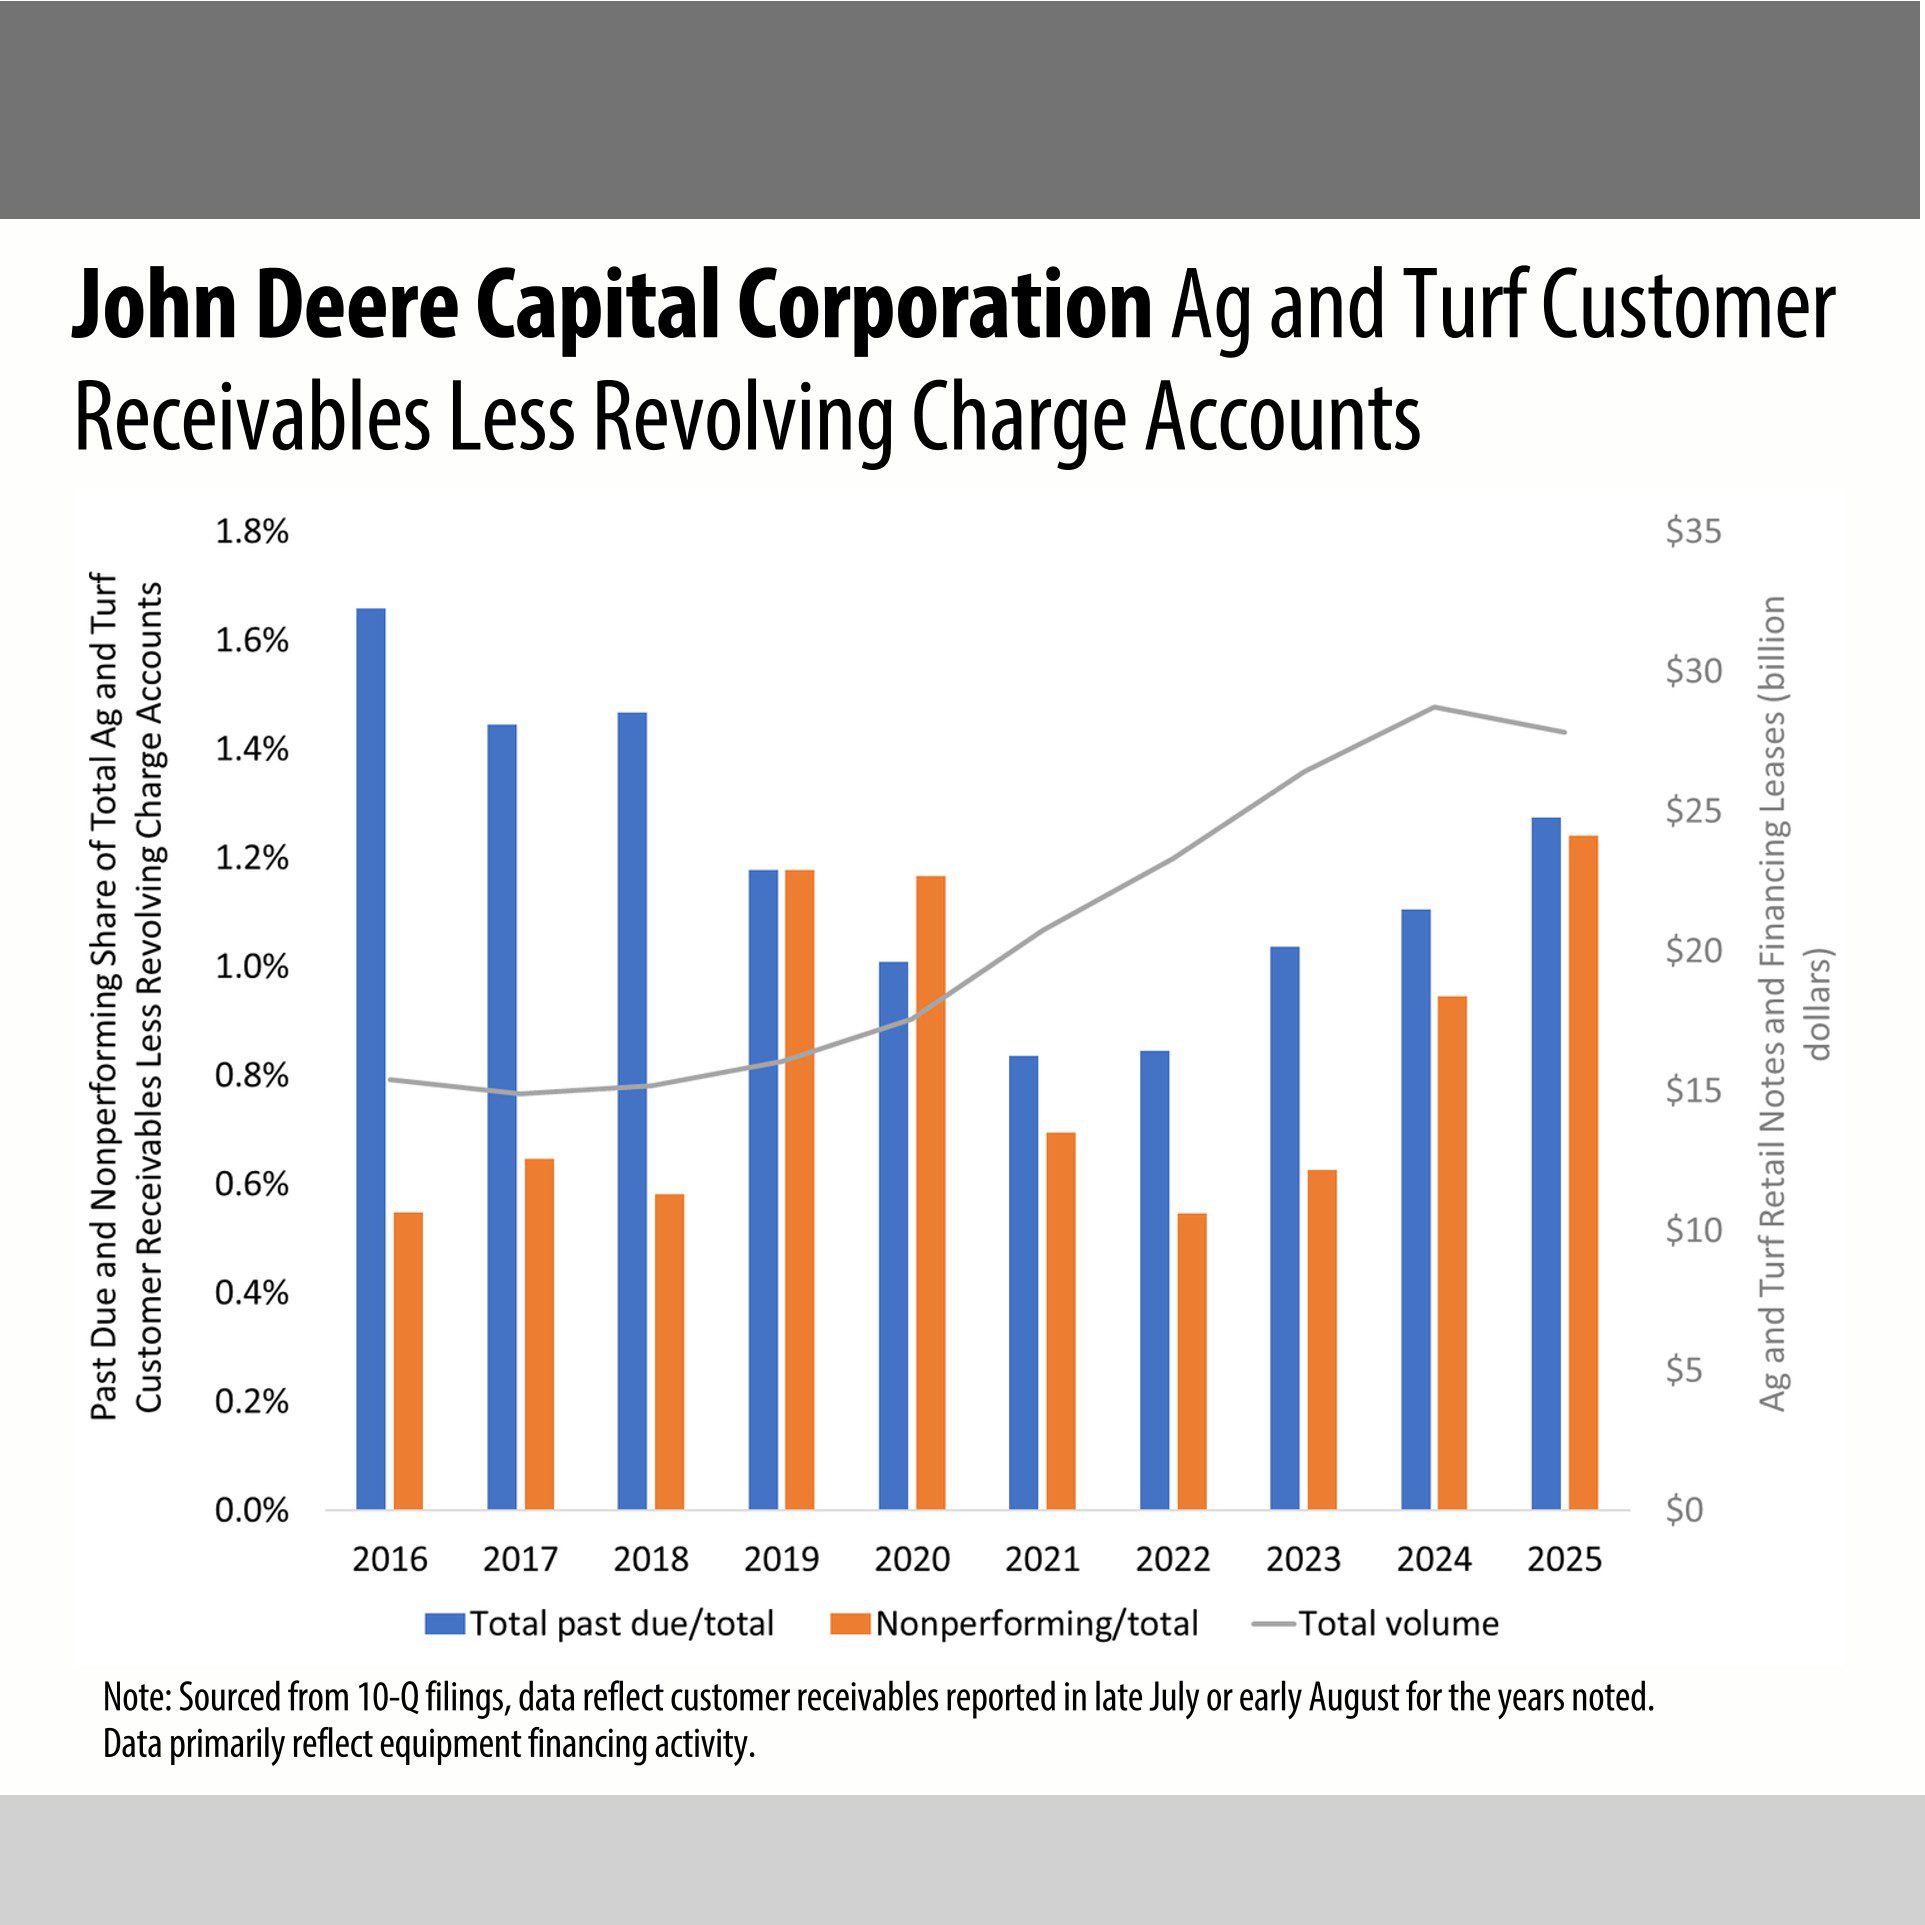
The ag and turf customer receivables financed by John Deere Capital Corporation represent equipment loans and leases in the agriculture and turf business units. From July/August 2024 to 2025, the volume declined by 3% to reach $27.8 billion, and credit quality deteriorated somewhat.
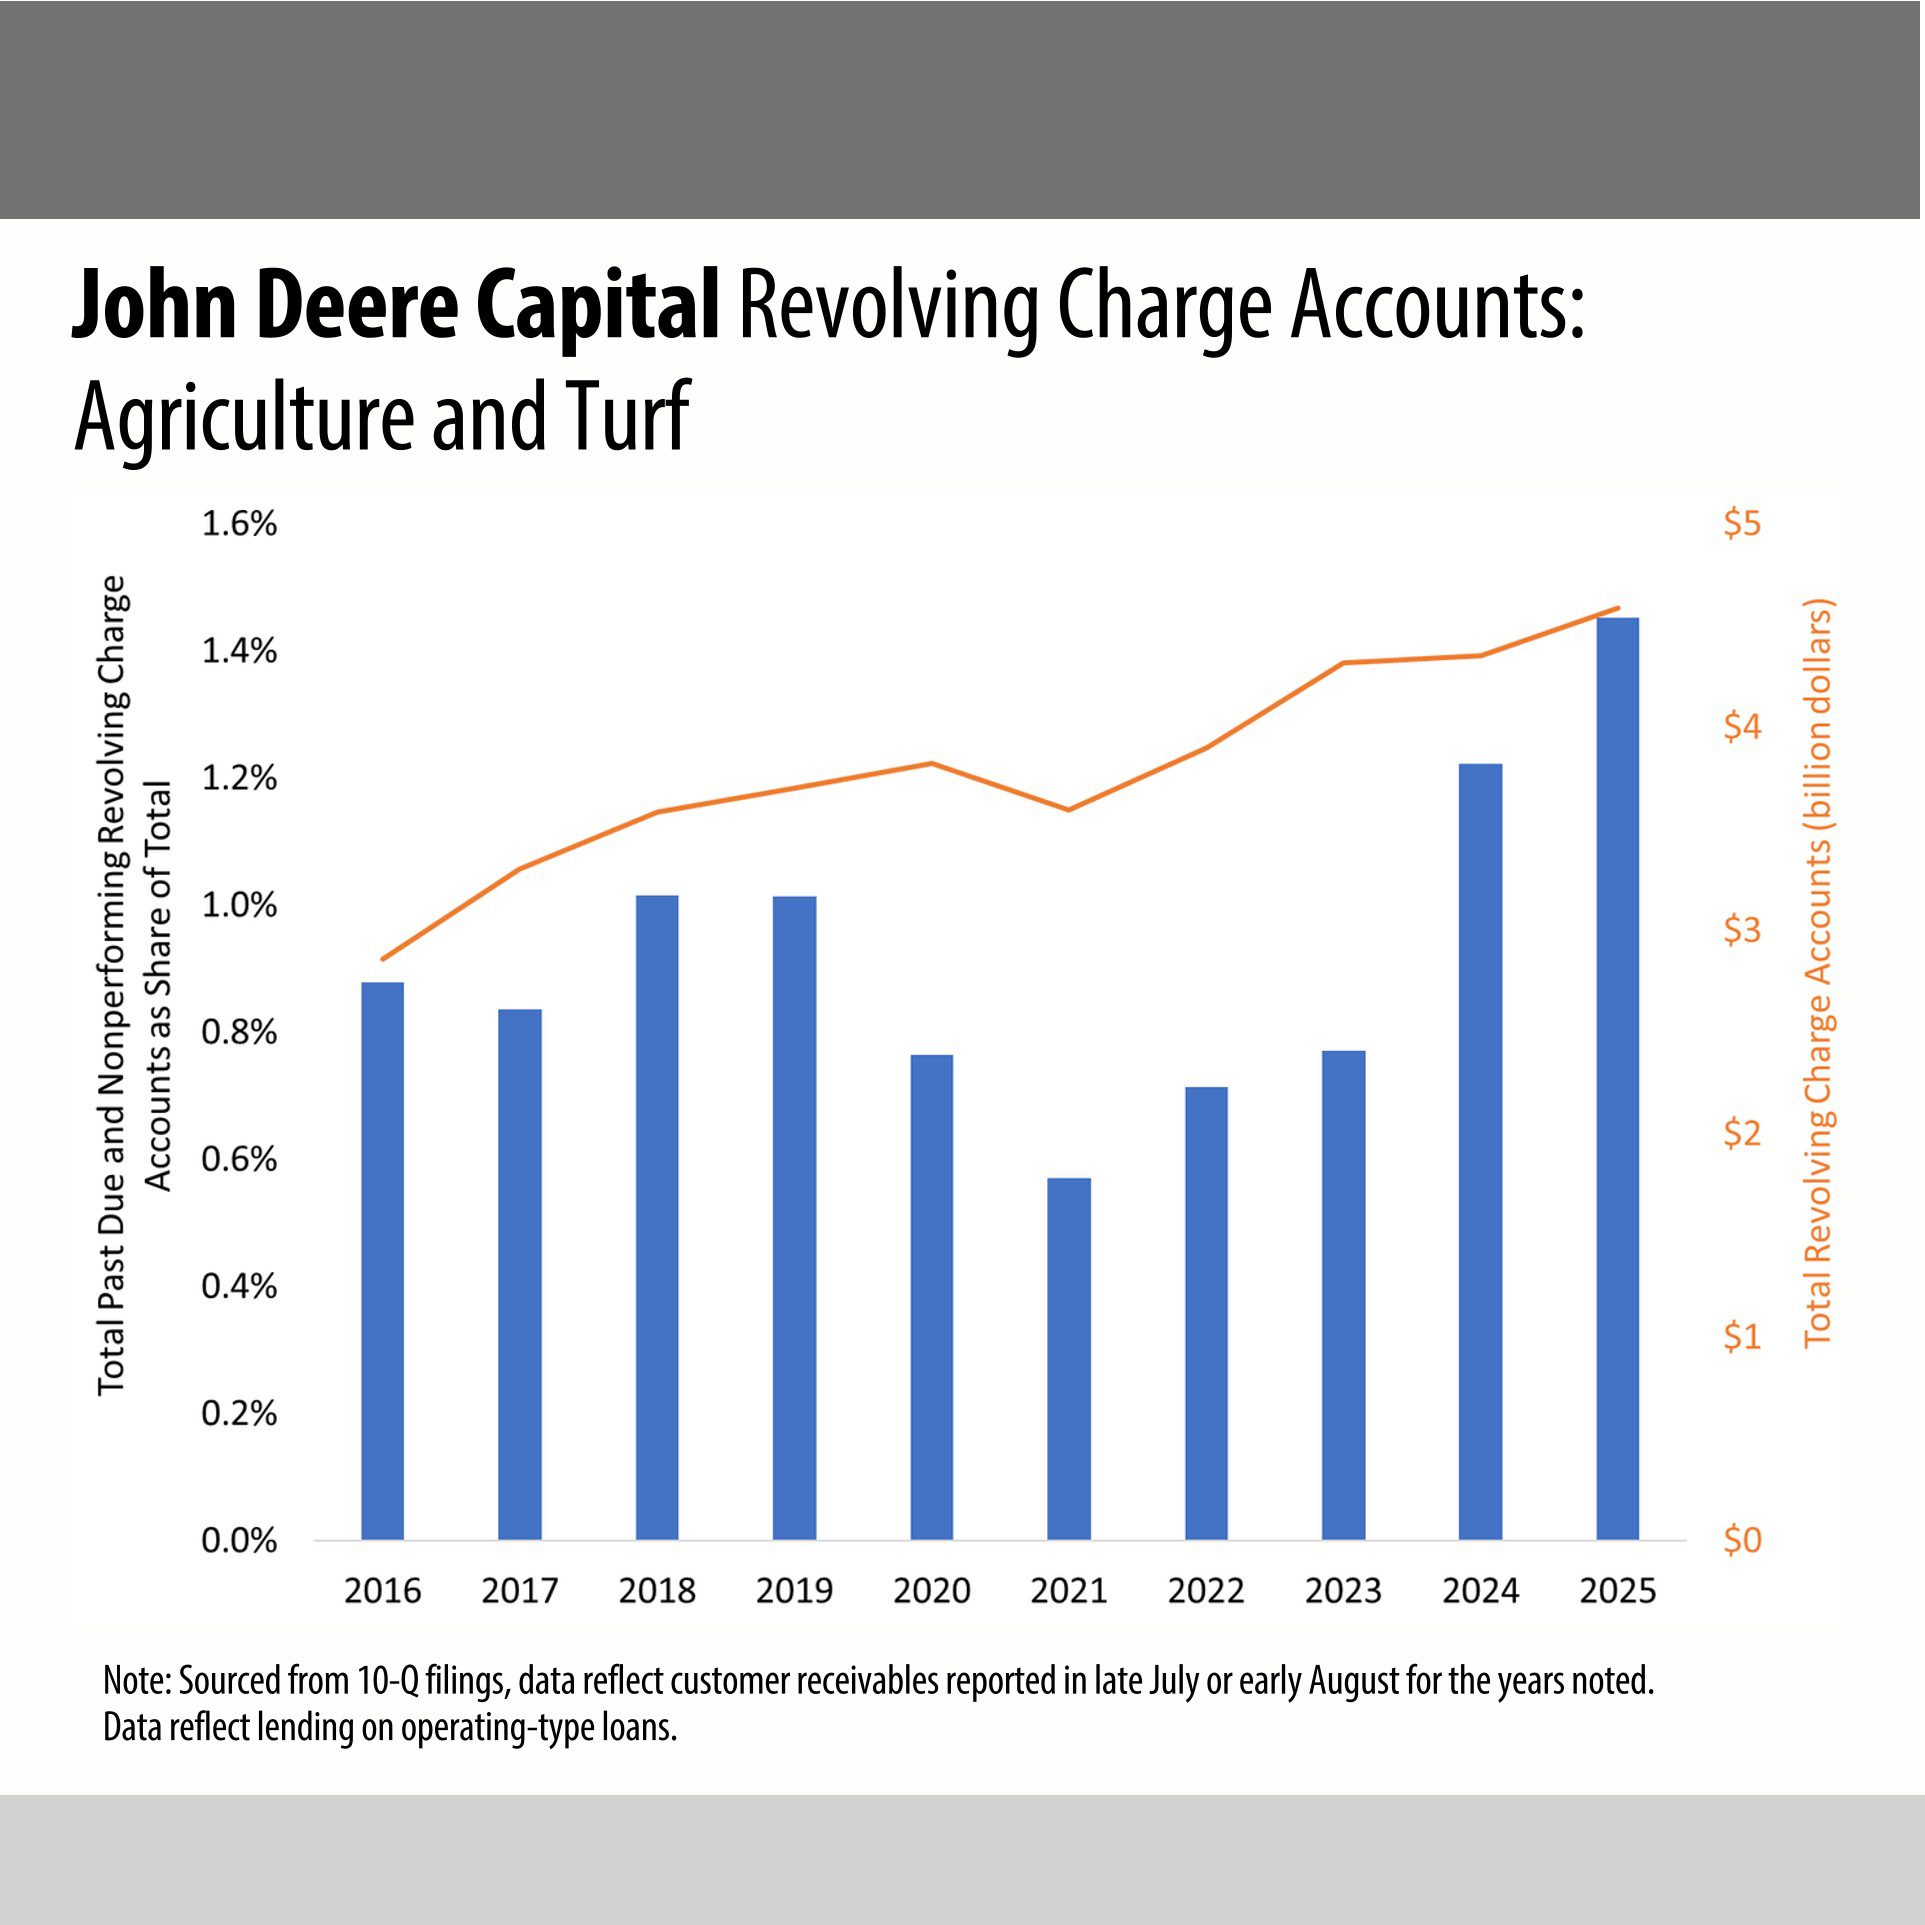
Revolving charge accounts financed by John Deere Capital function more as operating loans. Their total volume grew from July/August 2024 to 2025 to reach $4.6 billion. Past due and nonperforming as a share of the total increased from 1.2% to 1.5% during this time.
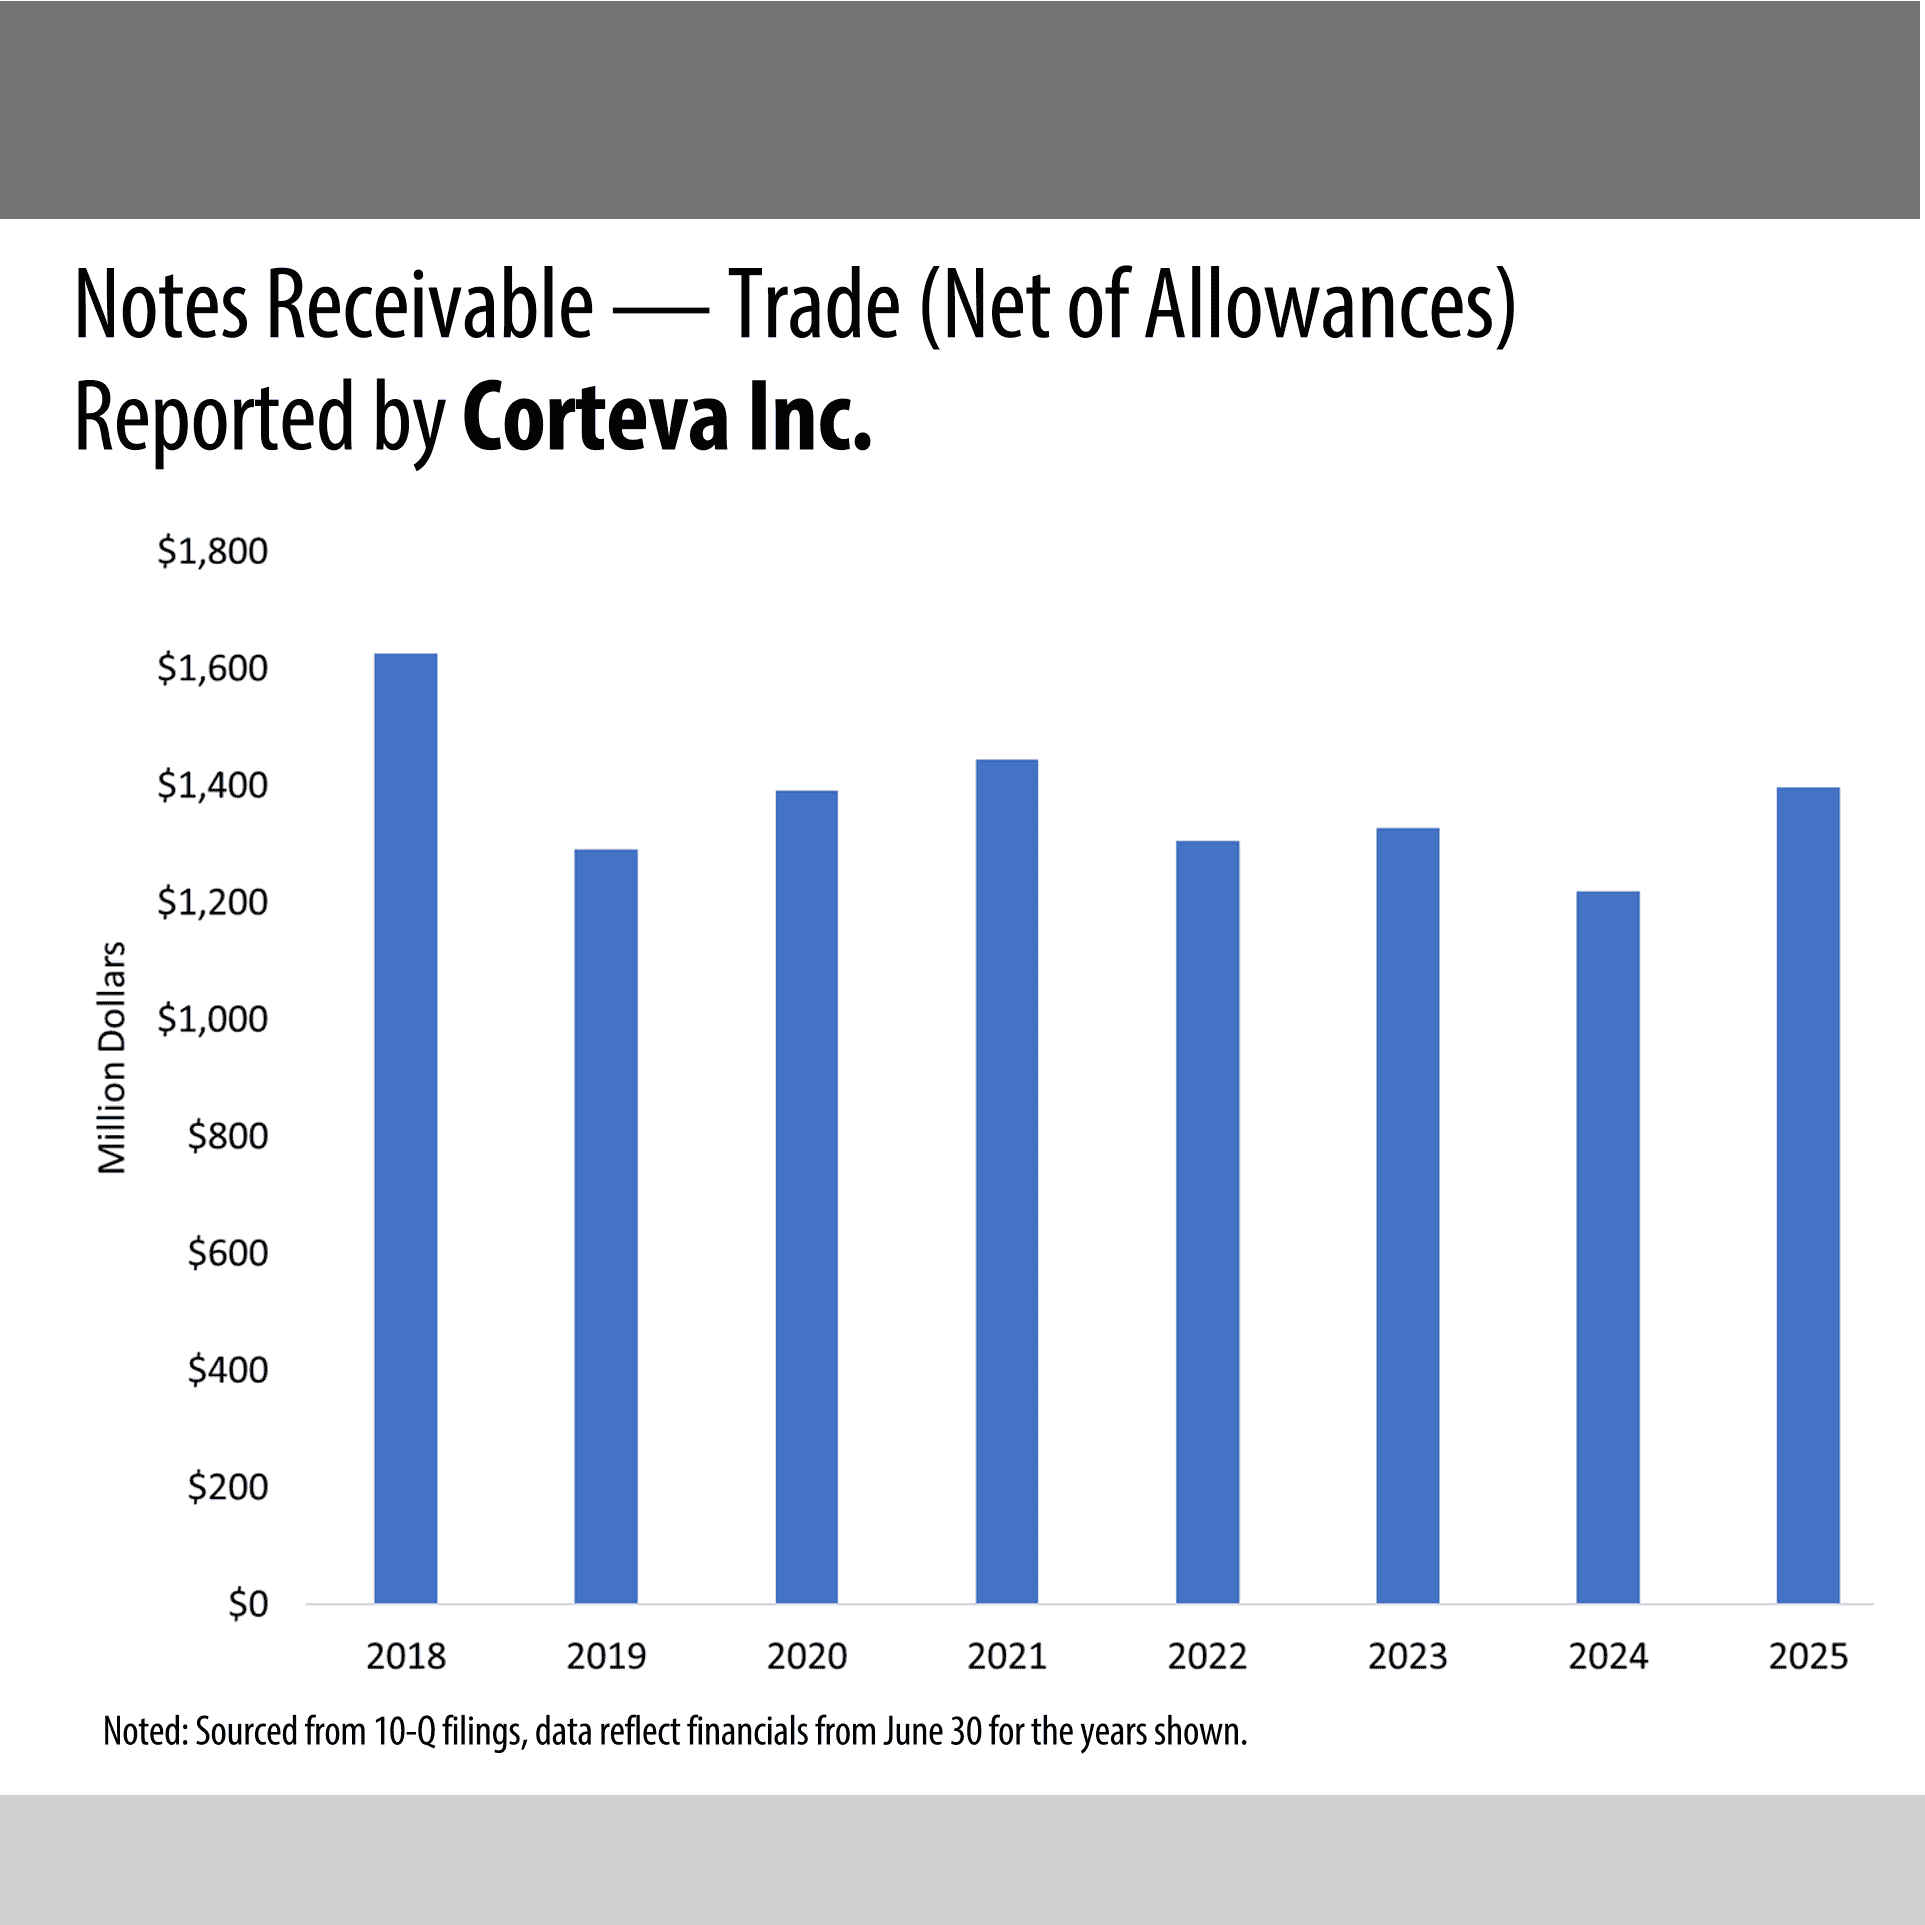
For Corteva Agriscience, the chart shows trade notes receivables, which mainly capture deferred payment loan programs for seed and chemicals. As of June 30, 2025, this debt totaled nearly $1.4 billion.
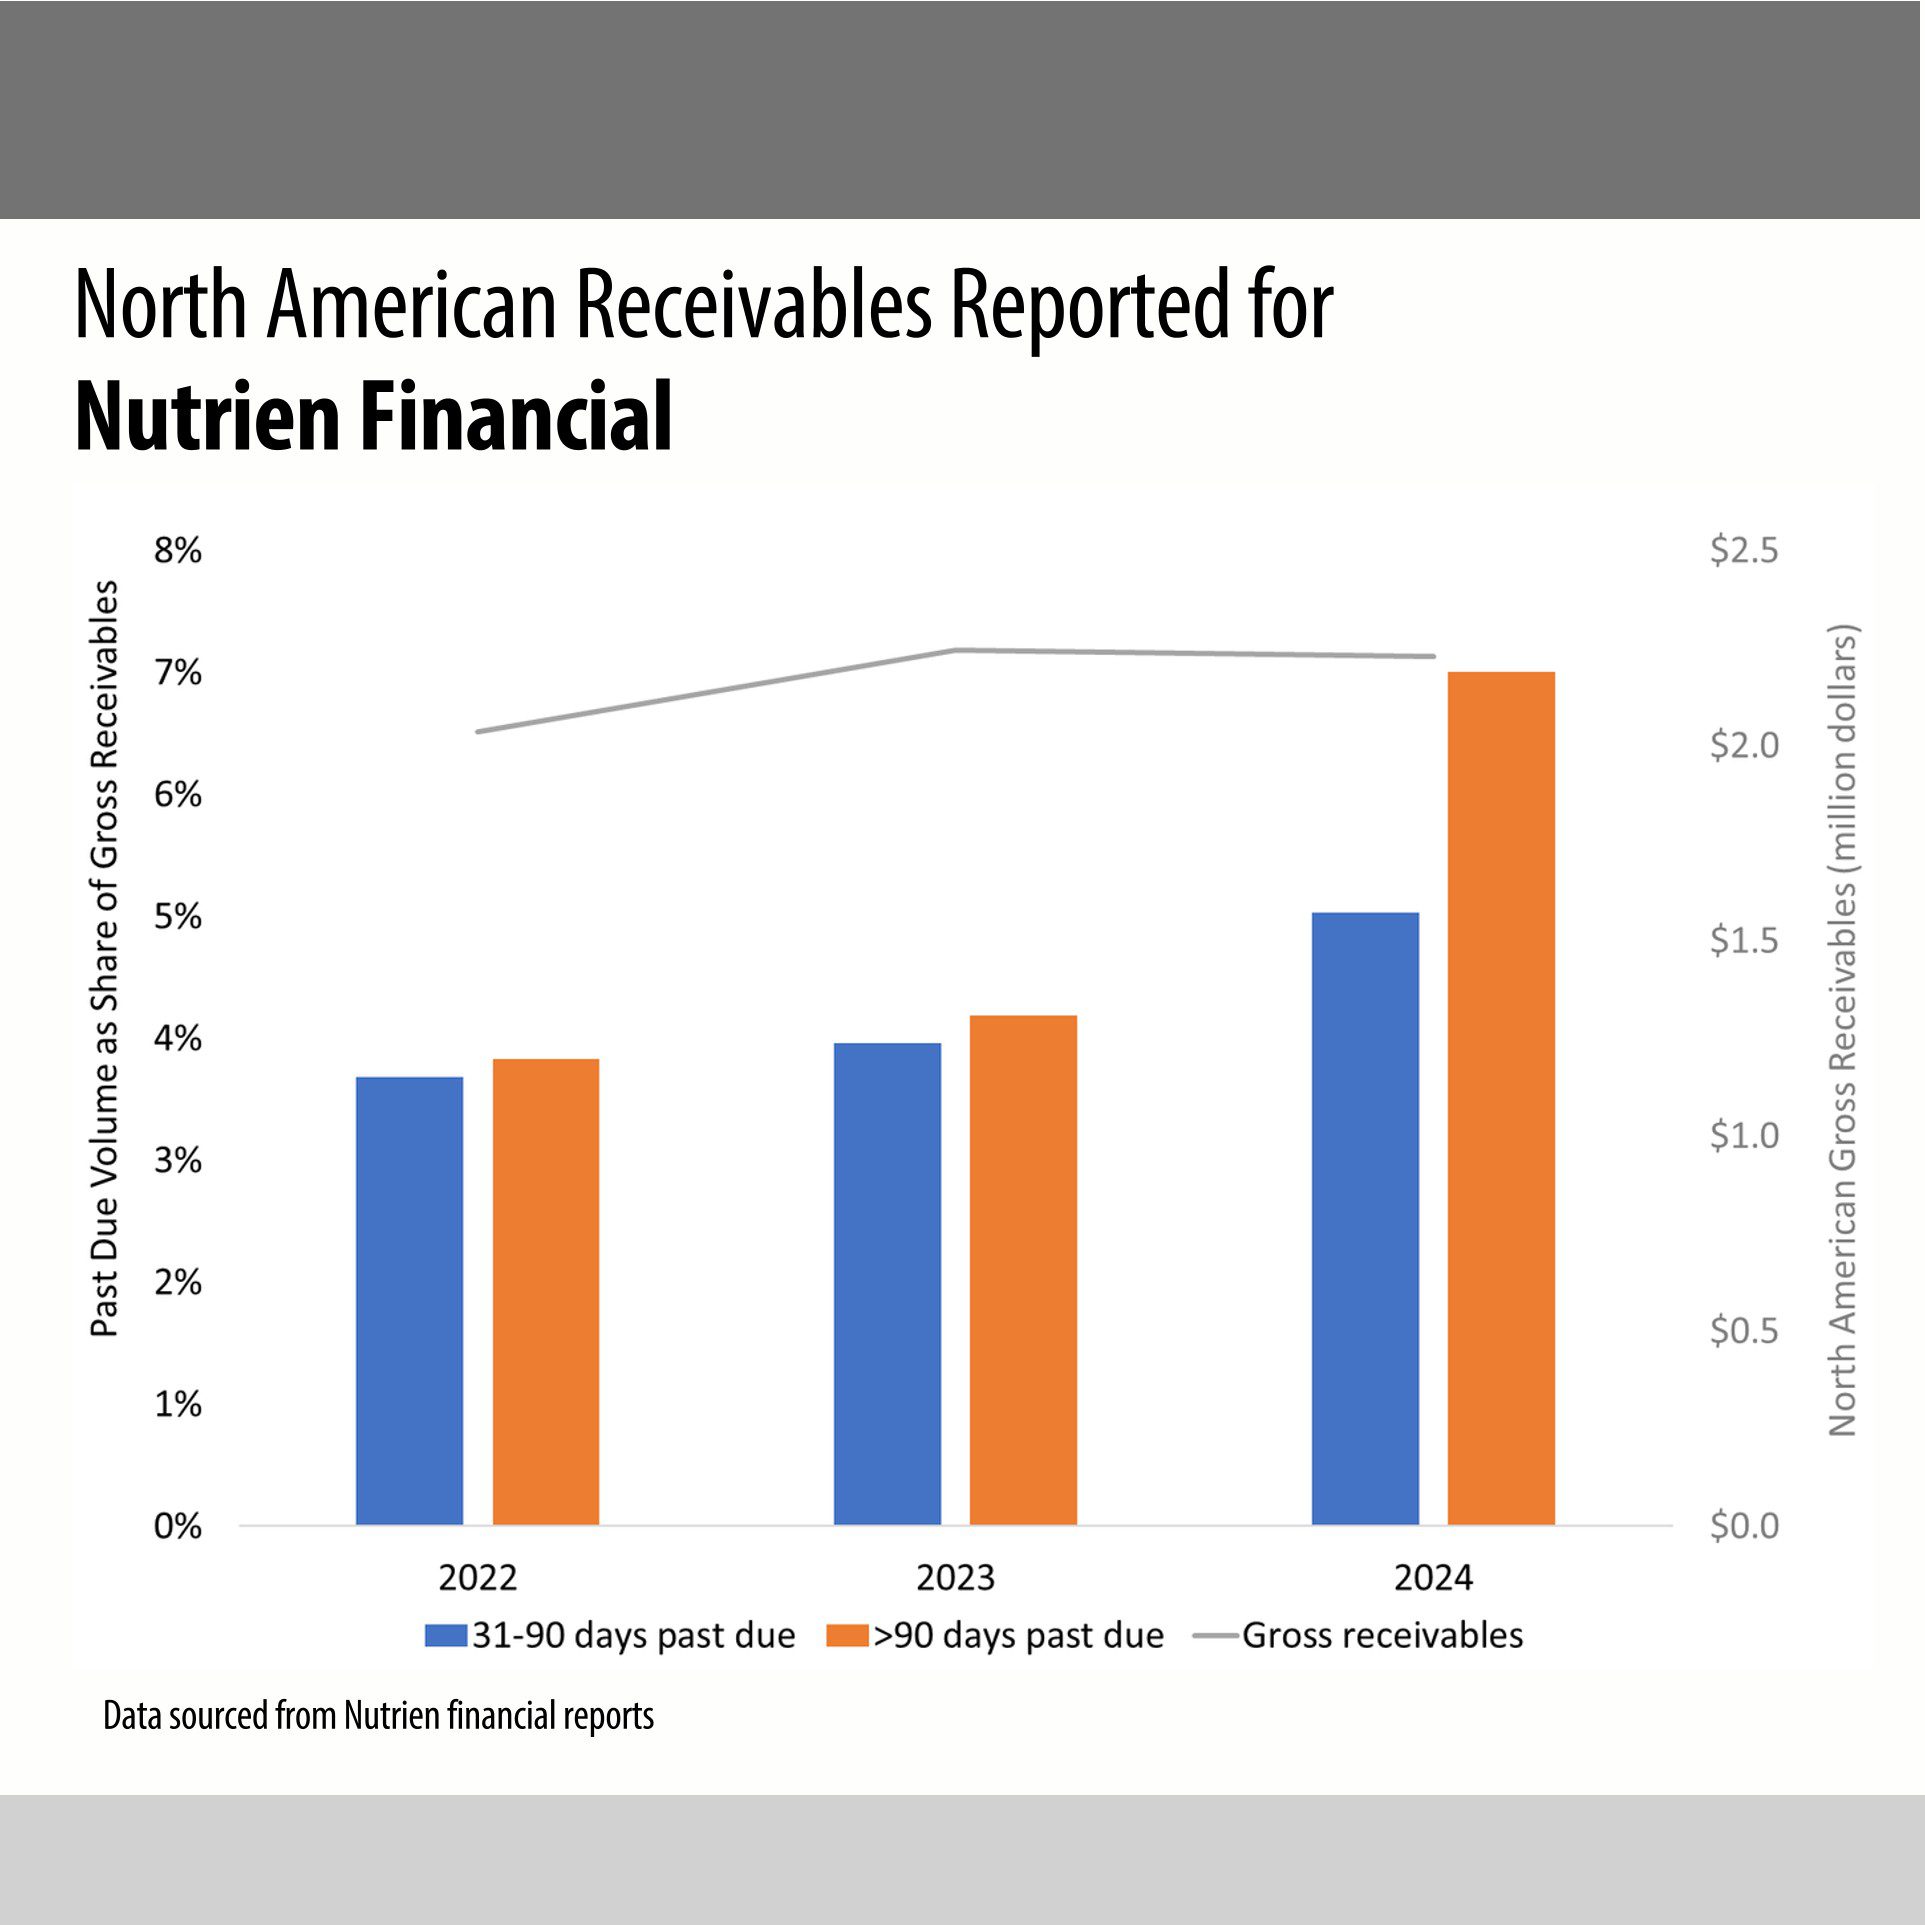
Credit quality of North American receivables reported by Nutrien Financial weakened from 2023 to 2024 — roughly 8% of gross receivables in 2023 were past due at least 31 days in 2023 compared with 12% in 2024 — as total gross receivables plateaued.
John Deere Green: Using Publicly Reported Data to Approximate John Deere’s Contribution to Nontraditional Farm Finance
February 2, 2026
By: Jennifer Ifft, Joe Parcell, Alice Roach
Within the farm machinery market, John Deere operates not only as a manufacturer and marketer but also as a nontraditional lender. It makes credit available to farms purchasing machinery and equipment. Plus, in cooperation with other input suppliers, it offers financing for other products (e.g., seed, crop protection). For example, its multi-use program offers financing for crop inputs and John Deere equipment parts and service.
Across the farm sector, nontraditional lending likely has been undercounted because these lenders don’t always have public reporting requirements. In a 2024 RaFF policy brief, we discussed how nontraditional equipment loan volume is likely underestimated. This and other evidence suggests nontraditional lenders (classified as “individuals and others”) extend at least two times the amount of non real estate debt reported by USDA.
As a financing entity for John Deere, John Deere Capital Corporation publicly reports its financial information. When available, this type of data from nontraditional lenders can lead to a better understanding of farm debt volumes and credit quality.
Click on the figures below for highlights of John Deere’s participation in farm debt financing.
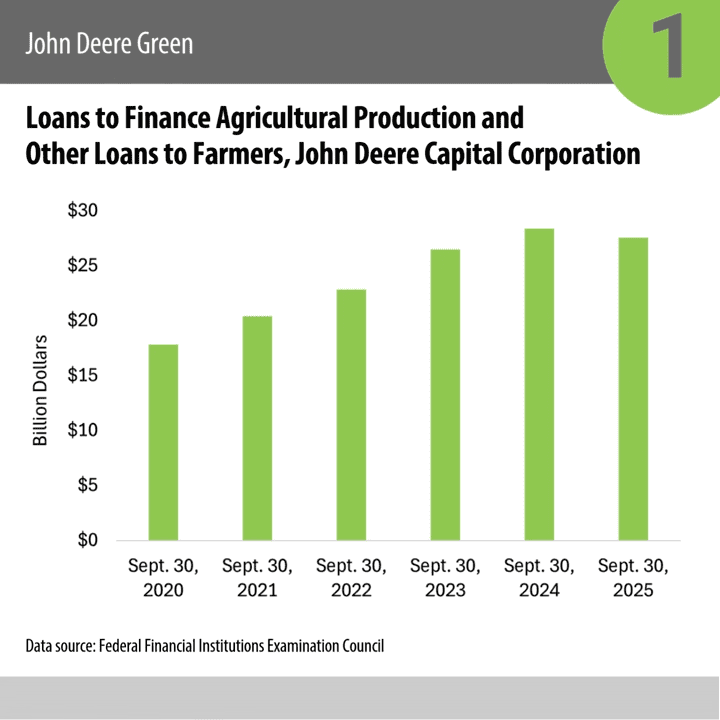
As of Sept. 30, 2025, John Deere Capital Corporation reported more than $27.5 billion in ag loans, according to reports published by the Federal Financial Institutions Examination Council. This was slightly less than the ag loans reported in 2024 but still a substantially larger volume than previous years. Between 2020 and 2025, ag loan volumes increased by 54%.
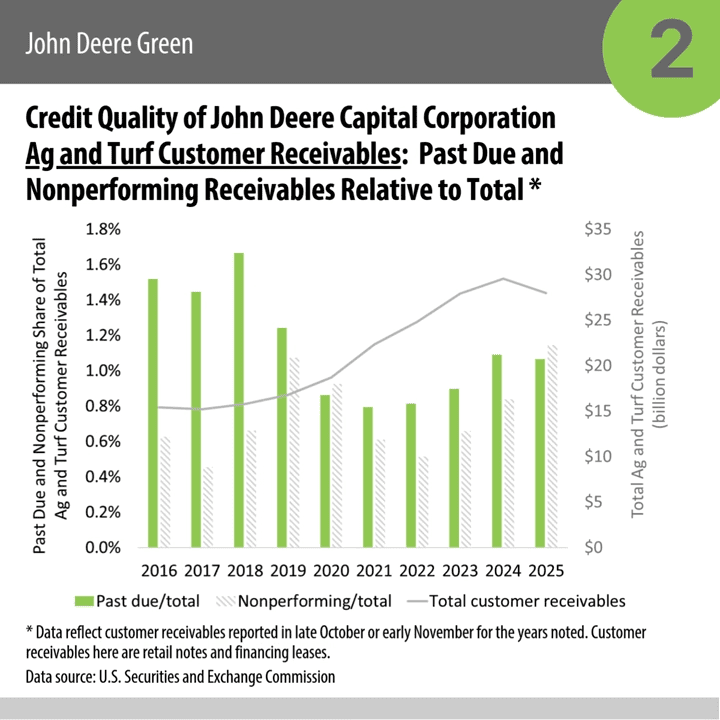
Quarterly and annual reports released through the U.S. Securities and Exchange Commission point to John Deere Capital Corporation’s credit quality. The business reported $28 billion in ag and turf customer receivables — assumably for equipment — at year-end 2025, which was Nov. 2. Of those loans, an estimated 1.1% were past due, and 1.1% were nonperforming. This was a marginal decrease from 2024 after past due peaks of around 1.5% from 2016–18 and a decline to 0.8% in 2021–22.
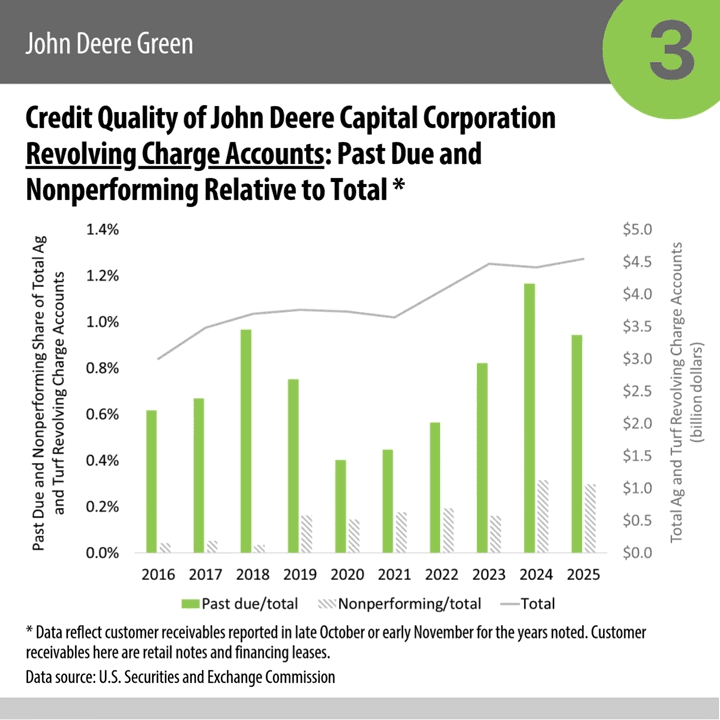
With respect to revolving charge accounts for the ag and turf segment, these accounts totaled an estimated $4.5 billion at year-end 2025. The past due share was 0.9% — down from 1.2% in the prior year. The nonperforming share was constant at 0.3% in 2024 and 2025. 2024 and 2025 levels are comparable to the 2018 level and substantially greater than 2020–21 levels.
Branching Out: Traditional Farm Lenders Diversifying Into Nontraditional Financing Activities
March 10, 2026
By: Jennifer Ifft, Joe Parcell, Alice Roach
Often, we think of nontraditional farm lenders as institutional investors, private banks and input vendors. However, some traditional lenders, including commercial banks and Farm Credit associations, have added business units that fit a nontraditional finance mold more than a traditional one.
Banks and Farm Credit lenders can expand their core businesses into nontraditional finance to expand borrower access to credit alternatives, pool resources with other lenders, reach new customers, and generate added revenue. They frequently promote nontraditional alternatives for their simplicity and convenience.
These five examples highlight how Farm Credit institutions have diversified into nontraditional finance.
AgDirect offers new and used equipment loan and lease financing and refinancing to farmers who acquire equipment from a dealer, auction, or private party. Farm Credit Services of America developed AgDirect and continues to administer the program, but 14 other associations participate today. The venture had $5.1 billion in outstanding participations as of Dec. 31, 2025.
Farm Credit Express offers point-of-sale financing for equipment, irrigation systems and trailers through a network of more than 1,200 dealers. Its services include loans and leases for new and used equipment. Horizon Farm Credit has administered the program for peer associations in the AgFirst territory. Notes closed in 2024 totaled roughly $188 million.
Agri-Access operates in the secondary market for agricultural loans, purchasing participations that allow banks and other lenders to manage liquidity and risk while maintaining borrower relationships. Agri-Access, a unit of Compeer Financial, also provides capital, underwriting, servicing, and digital infrastructure for lending programs branded uniquely to agricultural retailers and fintech partners.
ProPartners Financial has designed more than 200 private-label crop input financing programs for ag retailers, cooperatives and seed and chemical companies. Its annual loan commitments exceed $5 billion. Nine Farm Credit institutions own and fund ProPartners Financial. Compeer Financial is the facilitating association.
The Farm Credit Leasing Services Corporation serves farmers, co-ops, rural utilities and other eligible borrowers by offering lease financing for assets including machinery, equipment and facilities. A CoBank subsidiary, the corporation is one of six service corporations within the Farm Credit System. In 2024, it had $4.2 billion in net loans, notes, sales contracts and leases.
Shifting Assets: Share of Financial Assets Held by Nonbank Financial Intermediaries
April 1, 2026
By: Jennifer Ifft, Joe Parcell, Alice Roach
Collectively known as nonbank or nontraditional lenders, vendors, private banks, credit unions, family, friends and other groups often provide debt financing to farms. As part of our partnership with RaFF, we’ve found that debt extended by such lenders totals a value likely larger than published estimates suggest.
Agriculture is far from an anomaly in terms of nonbank finance activity.
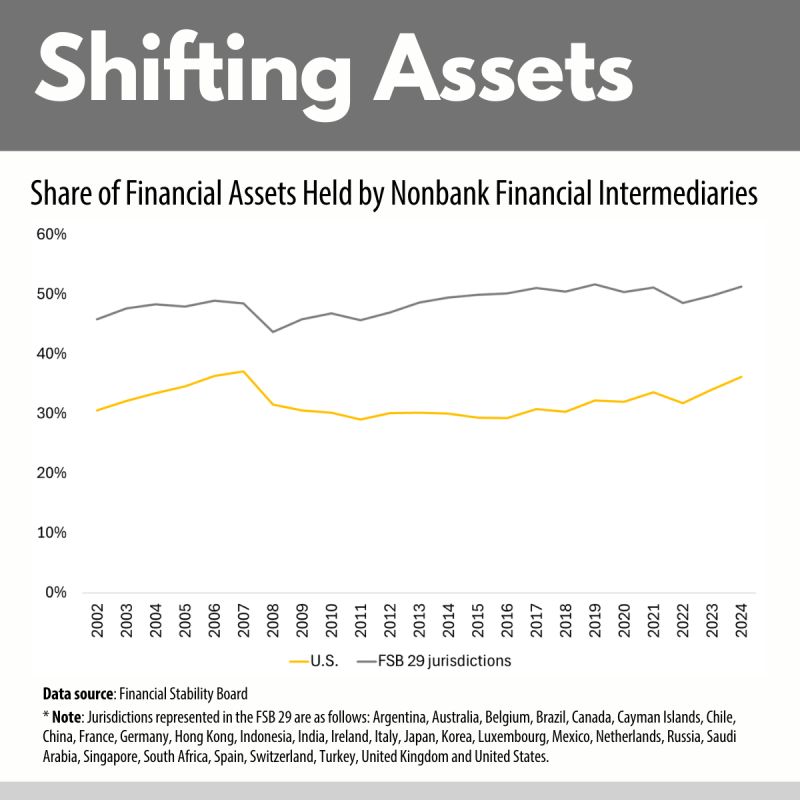
The Financial Stability Board (FSB) monitors the global financial system and recommends financial sector policies. As part of its mission, it tracks financial assets held by nonbank financial intermediaries (NBFIs) — a category of entities and individuals other than central banks, banks and public financial institutions.
Financial assets in NBFI portfolios may include money market funds, hedge funds, pension funds and insurance products. For the 29 countries* making up 90% of the world’s GDP tracked by the FSB, the chart below shows NBFIs held more than half of all financial assets in 2024 — nearly $257 trillion.
In 2024, of the reported U.S. $145 trillion in financial assets, nearly two-thirds traced to NBFI sources. Of the $94.5 trillion in U.S. NBFI assets, “other financial intermediaries” such as hedge funds, trust companies and captive financial institutions captured a 56% share.
The FSB acknowledges the credit, competition, and innovation facilitated by NBFIs. Some NBFI activity, however, could expose the financial system to risk. The Congressional Research Service explains more about the risks and policy implications. The risks have motivated NBFI monitoring.
The FSB tracks a “narrow measure,” which accounts for assets vulnerable to “bank-like financial security risks … and/or regulatory arbitrage.” Narrow measure assets totaled $76.3 trillion in 2024 — more than 15% of all financial assets. In the U.S., narrow measure assets reached nearly $24 trillion and represented more than 16% of total financial assets.
Little evidence indicates NBFI activity changed abruptly in 2024. However, activities captured in the “narrow measure” may pose vulnerabilities to the financial system during periods of stress. Agricultural credit markets, shaped by specialized lenders and relationships, may not fully reflect these broader trends. That said, similar concerns about measurement and reliance on short-term financing could become more important if conditions deteriorate.
Read more about nonbank financial intermediaries in the FSB monitoring report.
General U.S. Nonbank Lending is Substantial
May 7, 2026
By: Jennifer Ifft, Joe Parcell, Alice Roach
A substantial amount of U.S. and global financial system activity traces to nonbank financial institutions (NBFIs) — individuals and entities other than banks. For example, of the $145 trillion in U.S. financial assets, nearly two-thirds traced to NBFI sources in 2024, according to reporting from the Financial Stability Board (FSB).
“Financial assets” represent a broad mix of financial instruments that include but are not limited to loans. In our work with RaFF, we focus on better understanding nontraditional or nonbank loan activity for farm loans.
Quarterly, the Federal Reserve System updates its financial accounts guide, which includes data that can help to examine loan assets held by lender type in domestic financial and nonfinancial sectors.
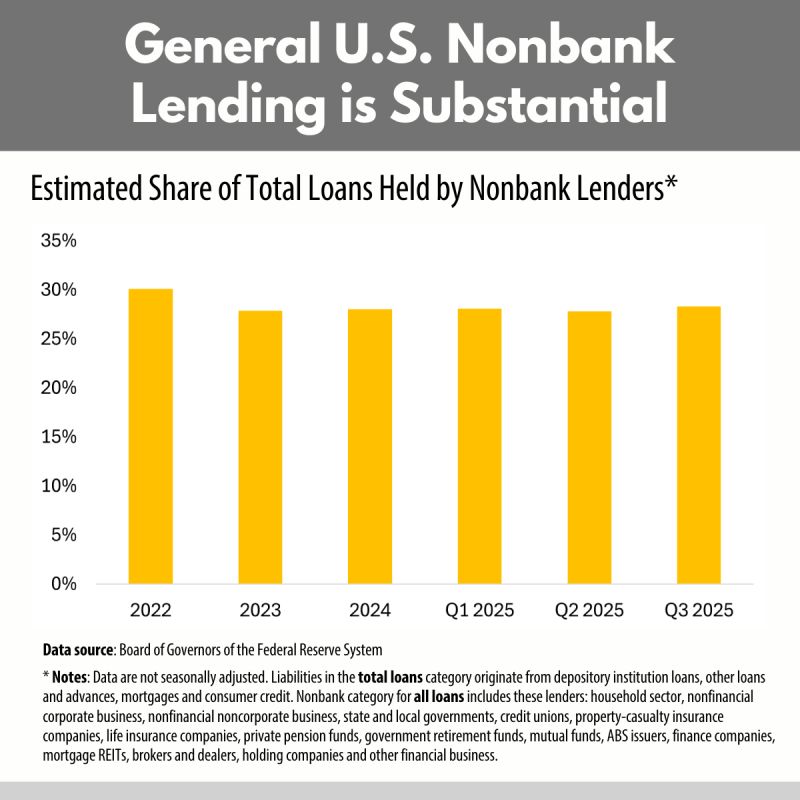
The chart shows the share of reported U.S. loans listed as assets of nonbank-type lenders. Consistently since 2022, more than one-quarter of all U.S. loans in the Federal Reserve dataset have been held by nonbank-type lenders.
Precisely measuring nonbank lending activity has its challenges, including incomplete data reporting. We’ve found, for example, that the share of U.S. farm loans classified as being financed by “individuals and others” is likely at least twice the value shown in official USDA reporting. Read more in this RaFF Policy Brief about how we arrived at our estimate.
Matching up data for general nonbank-type lending classifications used by the Federal Reserve and those used by USDA for farm loans suggests that these two data sources find a comparable share loans originating from nonbank lenders. If one doubles the share of loans from “individuals and others” and adds that to reported life insurance company holdings, the broader nonbank loan share for farm loans would total about 24% in 2024. This is remarkably close to the general economy nonbank loan share estimated using the Federal Reserve financial accounts data.
Supplier Financing in Agricultural Credit Markets
June 30, 2026
By: Jennifer Ifft, Joe Parcell, Alice Roach, Delaney New
In 2025, CropLife ranked Nutrien as the largest U.S. ag retailer by total sales. Nutrien provides fertilizer, crop protection products, seed, and agronomic services to producers. Customers can also seek financing for input purchases through Nutrien Financial.
Nontraditional lending activity, including credit provided by input suppliers such as Nutrien, is challenging to measure because these lenders generally do not face the same reporting requirements as commercial banks or Farm Credit institutions. As part of our work with the Rural and Farm Finance Policy Analysis Center (RaFF) at Mizzou, we are examining how these lenders fit into the broader supply of agricultural credit.
One source we review is financial reporting from publicly traded companies. Nutrien includes information on Nutrien Financial in its annual reports, which provides a partial view of the scale and credit quality of supplier-financed farm debt.
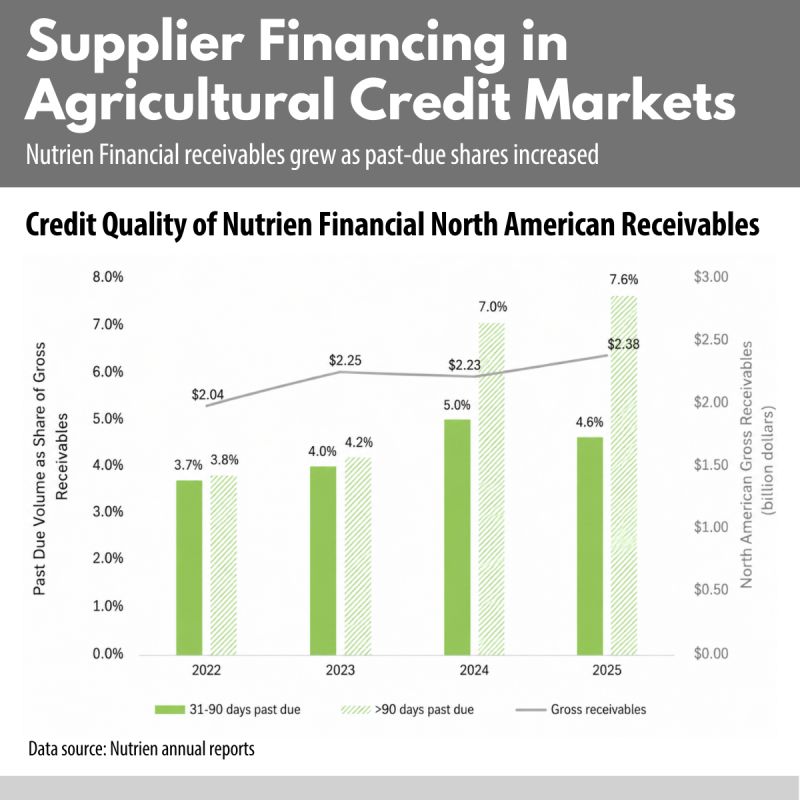
The figure highlights Nutrien Financial’s North American portfolio from 2022 to 2025. Three points stand out:
- Gross receivables increased. Nutrien Financial’s gross receivables rose from approximately $2.0 billion in 2022 to nearly $2.4 billion in 2025, suggesting continued demand for financing tied to input purchases.
- Short-term past-due shares increased modestly. Receivables 31 to 90 days past due increased from 3.7% in 2022 to 4.6% in 2025, after reaching 5.0% in 2024.
- Longer-term past-due shares have also increased. Receivables more than 90 days past due increased from 3.8% in 2022 to 4.2% in 2023, then rose sharply to 7.0% in 2024 and 7.6% in 2025.
What are you hearing or observing about farm debt financed through input suppliers?
Signup For Our Email Announcements
